Figure B
States with the largest declines in collective bargaining have had slower pay growth: Median hourly compensation growth and change in state collective bargaining coverage, 1979–2012
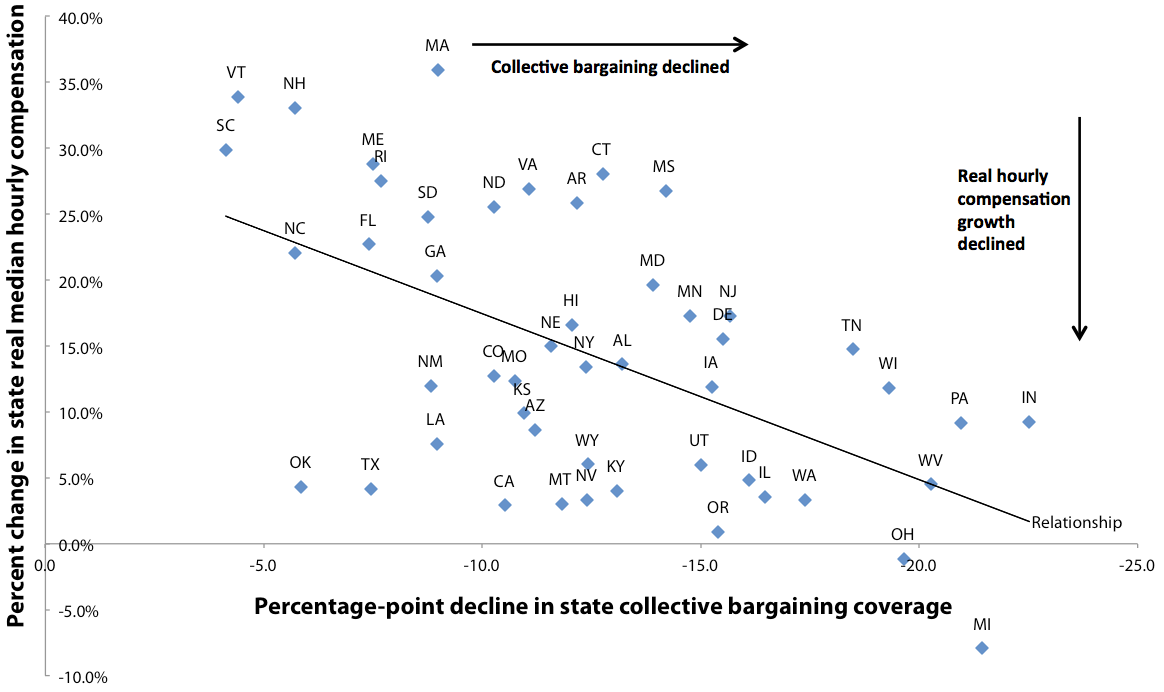
Note: Excludes Alaska and the District of Columbia.
Source: Adapted from Figure B in David Cooper and Lawrence Mishel, The Erosion of Collective Bargaining Has Widened the Gap Between Productivity and Pay, EPI Report, January 6, 2015
This chart appears in:
Previous chart: « Share of prime-age workers with a job hasn’t recovered from the recession: Employment-to-population ratio of workers age 25–54, 1989–2015