Per capita Social Security expenditures and the elderly poverty rate, 1959–2013
| Year | Share of the elderly population below the poverty line (left axis) | Elderly poverty rate, extrapolated | Social Security expenditures per capita (right axis) |
|---|---|---|---|
| Jan-1959 | 35.2% | $408.45 | |
| Jan-1960 | 34.2% | $429.40 | |
| Jan-1961 | 33.3% | $467.36 | |
| Jan-1962 | 32.3% | $511.64 | |
| Jan-1963 | 31.4% | $530.30 | |
| Jan-1964 | 30.4% | $540.40 | |
| Jan-1965 | 29.5% | $591.27 | |
| Jan-1966 | 28.5% | 28.5% | $616.77 |
| Jan-1967 | 29.5% | $635.20 | |
| Jan-1968 | 25.0% | $699.45 | |
| Jan-1969 | 25.3% | $708.83 | |
| Jan-1970 | 24.6% | $790.36 | |
| Jan-1971 | 21.6% | $866.10 | |
| Jan-1972 | 18.6% | $931.17 | |
| Jan-1973 | 16.3% | $1,064.81 | |
| Jan-1974 | 14.6% | $1,086.57 | |
| Jan-1975 | 15.3% | $1,127.54 | |
| Jan-1976 | 15.0% | $1,190.14 | |
| Jan-1977 | 14.1% | $1,233.00 | |
| Jan-1978 | 14.0% | $1,262.13 | |
| Jan-1979 | 15.2% | $1,249.44 | |
| Jan-1980 | 15.7% | $1,287.95 | |
| Jan-1981 | 15.3% | $1,370.72 | |
| Jan-1982 | 14.6% | $1,435.83 | |
| Jan-1983 | 13.8% | $1,467.83 | |
| Jan-1984 | 12.4% | $1,478.49 | |
| Jan-1985 | 12.6% | $1,493.49 | |
| Jan-1986 | 12.4% | $1,538.61 | |
| Jan-1987 | 12.5% | $1,527.61 | |
| Jan-1988 | 12.0% | $1,554.09 | |
| Jan-1989 | 11.4% | $1,566.85 | |
| Jan-1990 | 12.2% | $1,580.98 | |
| Jan-1991 | 12.4% | $1,631.06 | |
| Jan-1992 | 12.9% | $1,647.72 | |
| Jan-1993 | 12.2% | $1,672.12 | |
| Jan-1994 | 11.7% | $1,688.07 | |
| Jan-1995 | 10.5% | $1,713.57 | |
| Jan-1996 | 10.8% | $1,711.63 | |
| Jan-1997 | 10.5% | $1,735.99 | |
| Jan-1998 | 10.5% | $1,749.78 | |
| Jan-1999 | 9.7% | $1,720.29 | |
| Jan-2000 | 9.9% | $1,737.73 | |
| Jan-2001 | 10.1% | $1,764.86 | |
| Jan-2002 | 10.4% | $1,786.95 | |
| Jan-2003 | 10.2% | $1,787.28 | |
| Jan-2004 | 9.8% | $1,786.72 | |
| Jan-2005 | 10.1% | $1,798.88 | |
| Jan-2006 | 9.4% | $1,796.52 | |
| Jan-2007 | 9.7% | $1,864.54 | |
| Jan-2008 | 9.7% | $1,855.14 | |
| Jan-2009 | 8.9% | $2,017.12 | |
| Jan-2010 | 8.9% | $2,041.18 | |
| Jan-2011 | 8.7% | $2,027.26 | |
| Jan-2012 | 9.1% | $2,108.05 | |
| Jan-2013 | 9.5% | $2,171.09 |
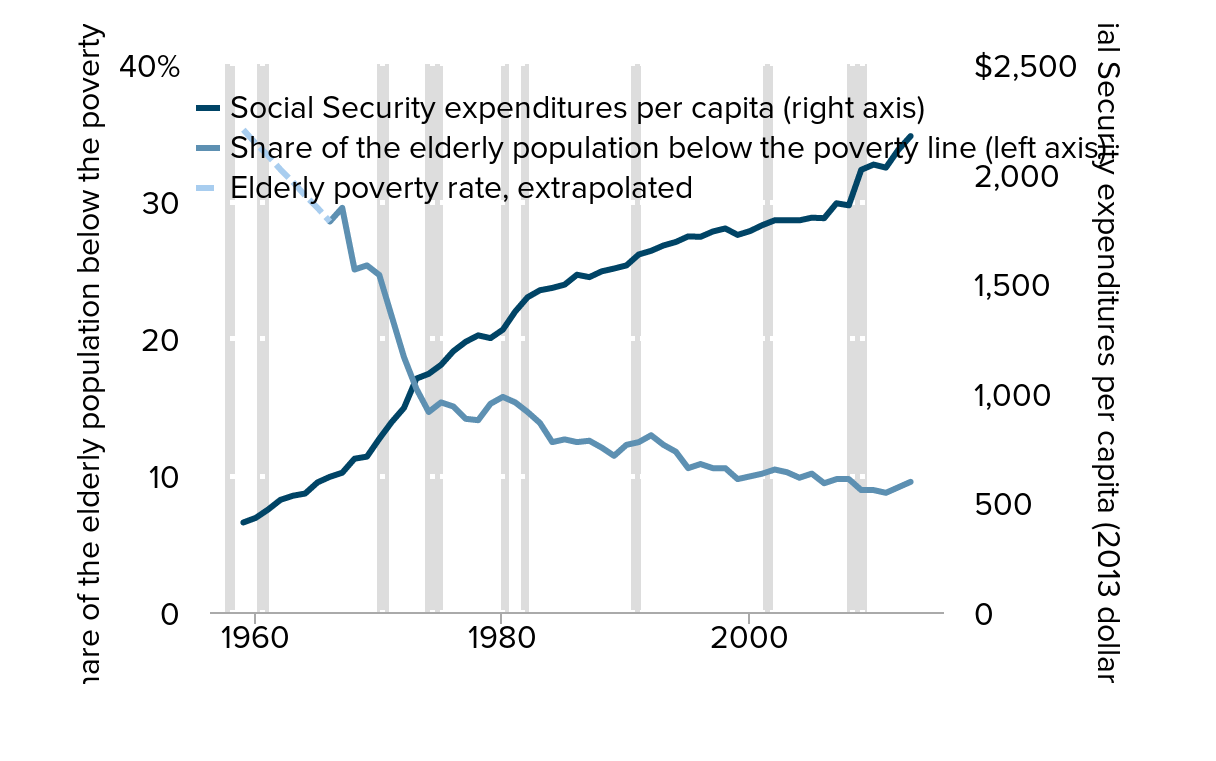
Note: No formal data exist for 1960–1965. The dotted lines denote a linear extrapolation between 1959 and 1966. Shaded areas denote recessions.
Underlying data are from Current Population Survey Annual Social and Economic Supplement Historical Poverty Tables, Table 2, “Poverty Status, by Family Relationship, Race, and Hispanic Origin,” and Table 3, “Poverty Status, by Age, Race, and Hispanic Origin.” Data are also from the Social Security Administration Trustees Report 2009: Annual Statistical Supplement, Table 4a, “Old-Age and Survivors Insurance Trust Fund Expenditures.”
Source: Authors' analysis of Current Population Survey Annual Social and Economic Supplement Historical Poverty Tables (Tables 2 and 3) and Social Security Administration (2009, Table 4a)
This chart appears in:
Previous chart: « Share of total household capital income claimed, by income group, 1979–2010
Next chart: Poverty rates of various types of families, 1959–2013 »