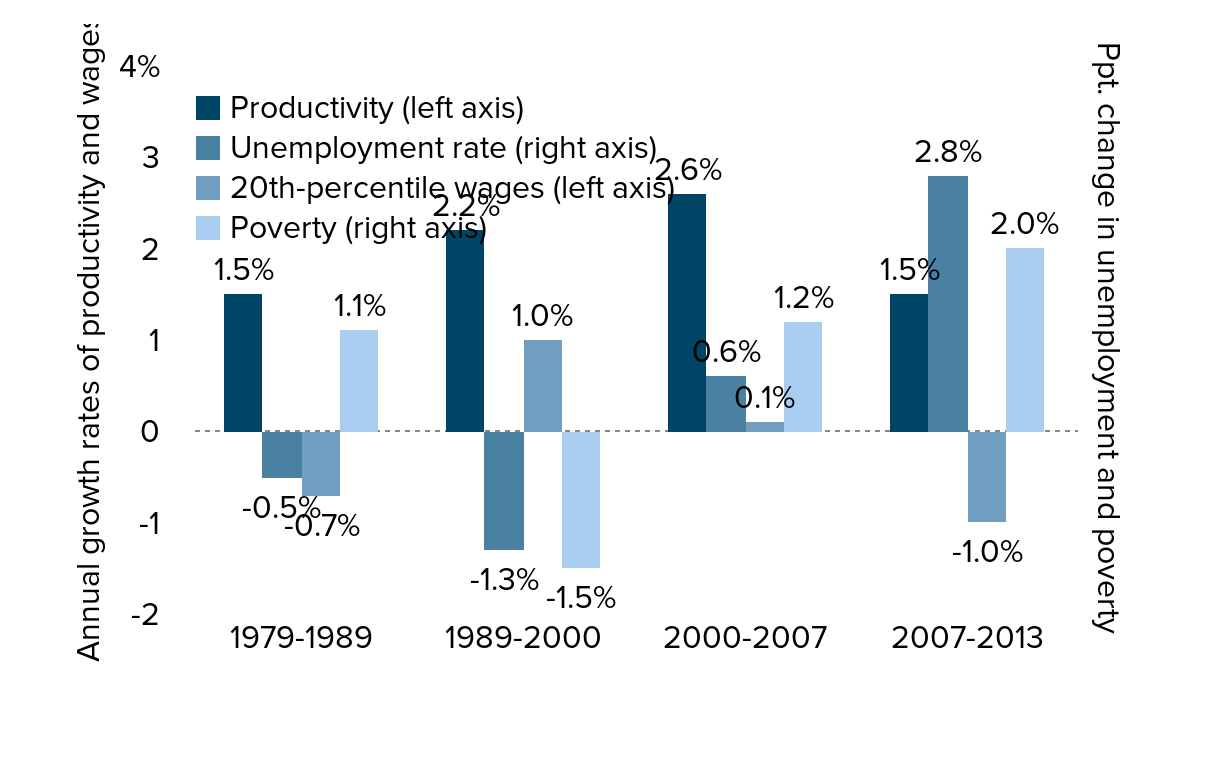
Change in productivity, 20th-percentile wages, unemployment, and poverty, selected periods, 1979–2013
| Productivity (left axis) | Unemployment rate (right axis) | 20th-percentile wages (left axis) | Poverty (right axis) | |
|---|---|---|---|---|
| 1979–1989 | 1.5% | -0.5 | -0.7% | 1.1 |
| 1989–2000 | 2.2% | -1.3 | 1.0% | -1.5 |
| 2000–2007 | 2.6% | 0.6 | 0.1% | 1.2 |
| 2007–2013 | 1.5% | 2.8 | -1.0% | 2.0 |

Productivity data, which measure output per hour, are from the Bureau of Labor Statistics Major Sector Productivity and Costs Index public data series; the figure shows the average annual growth rate of productivity over the periods covered. The figure also shows the average annual growth rate of wages at the 20th percentile of the wage distribution for the given periods, using data from Current Population Survey Outgoing Rotation Group microdata; see Appendix B for details. The percentage-point changes in the unemployment rate across the periods shown come from the monthly Current Population Survey public data series, while percentage-point changes in the poverty rate come from Current Population Survey Annual Social and Economic Supplement Historical Poverty Tables, Table 2, “Poverty Status, by Family Relationship, Race, and Hispanic Origin.”
Source: Authors' analysis of Bureau of Labor Statistics Major Sector Productivity and Costs Index, Current Population Survey Outgoing Rotation Group microdata, Current Population Survey public data series, and Current Population Survey Annual Social and Economic Supplement Historical Poverty Tables (Table 2)
This chart appears in:
Previous chart: « Poverty rates, official and under the Supplemental Poverty Measure, by age group, 2012
Next chart: Impact of changes in family structure on the poverty rate, selected periods, 1979–2013 »