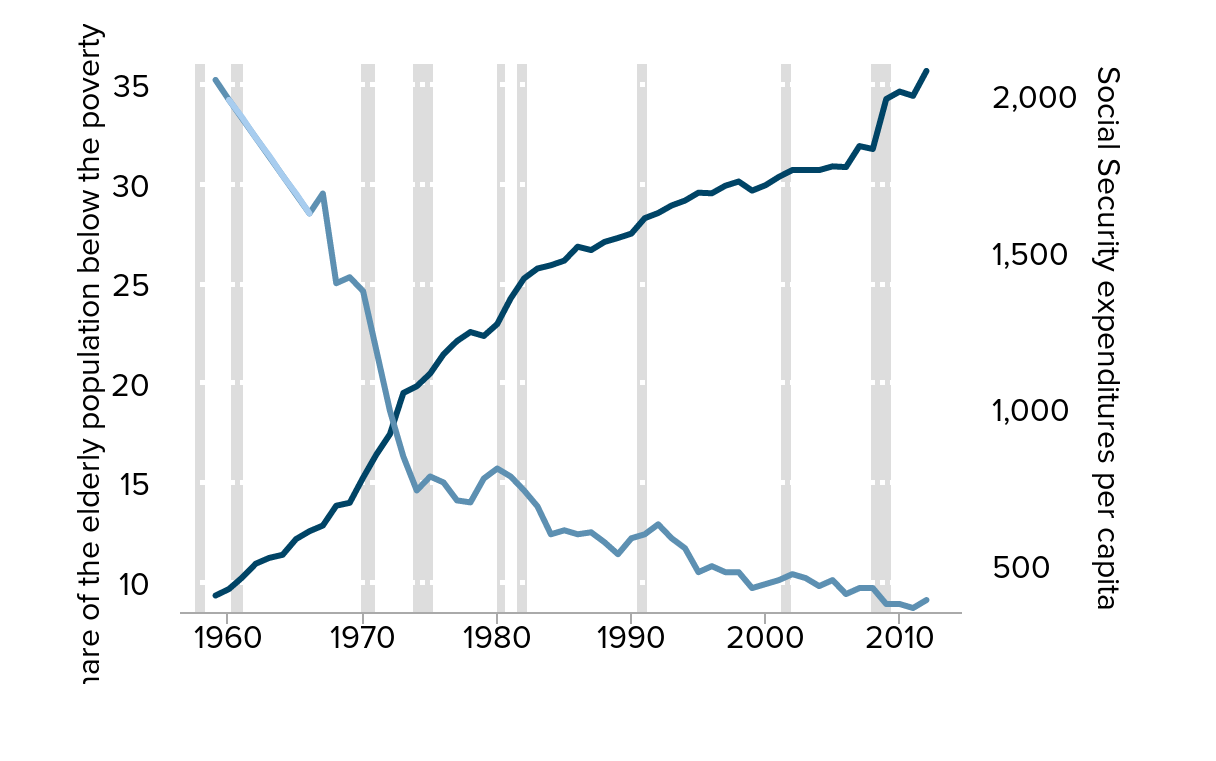
Figure 7R
Per capita Social Security expenditures and poverty rate for 65+, 1959–2012
| Year | Share of the elderly population below the poverty line | Poverty rate, 65+ extrapolation | Social Security expenditures per capita |
|---|---|---|---|
| Jan-1959 | 35.2% | $402.59 | |
| Jan-1960 | 34.2% | 34.2% | $423.25 |
| Jan-1961 | 33.3% | $460.66 | |
| Jan-1962 | 32.3% | $504.31 | |
| Jan-1963 | 31.4% | $522.70 | |
| Jan-1964 | 30.4% | $532.65 | |
| Jan-1965 | 29.5% | $582.81 | |
| Jan-1966 | 28.5% | 28.5% | $607.94 |
| Jan-1967 | 29.5% | $626.10 | |
| Jan-1968 | 25.0% | $689.43 | |
| Jan-1969 | 25.3% | $698.68 | |
| Jan-1970 | 24.6% | $779.04 | |
| Jan-1971 | 21.6% | $853.69 | |
| Jan-1972 | 18.6% | $917.83 | |
| Jan-1973 | 16.3% | $1,049.56 | |
| Jan-1974 | 14.6% | $1,071.00 | |
| Jan-1975 | 15.3% | $1,111.39 | |
| Jan-1976 | 15.0% | $1,173.09 | |
| Jan-1977 | 14.1% | $1,215.34 | |
| Jan-1978 | 14.0% | $1,244.05 | |
| Jan-1979 | 15.2% | $1,231.54 | |
| Jan-1980 | 15.7% | $1,269.50 | |
| Jan-1981 | 15.3% | $1,351.08 | |
| Jan-1982 | 14.6% | $1,415.26 | |
| Jan-1983 | 13.8% | $1,446.81 | |
| Jan-1984 | 12.4% | $1,457.31 | |
| Jan-1985 | 12.6% | $1,472.10 | |
| Jan-1986 | 12.4% | $1,516.58 | |
| Jan-1987 | 12.5% | $1,505.73 | |
| Jan-1988 | 12.0% | $1,531.83 | |
| Jan-1989 | 11.4% | $1,544.41 | |
| Jan-1990 | 12.2% | $1,558.34 | |
| Jan-1991 | 12.4% | $1,607.70 | |
| Jan-1992 | 12.9% | $1,624.12 | |
| Jan-1993 | 12.2% | $1,648.17 | |
| Jan-1994 | 11.7% | $1,663.89 | |
| Jan-1995 | 10.5% | $1,689.02 | |
| Jan-1996 | 10.8% | $1,687.11 | |
| Jan-1997 | 10.5% | $1,711.13 | |
| Jan-1998 | 10.5% | $1,724.72 | |
| Jan-1999 | 9.7% | $1,695.65 | |
| Jan-2000 | 9.9% | $1,712.84 | |
| Jan-2001 | 10.1% | $1,739.58 | |
| Jan-2002 | 10.4% | $1,761.35 | |
| Jan-2003 | 10.2% | $1,761.68 | |
| Jan-2004 | 9.8% | $1,761.13 | |
| Jan-2005 | 10.1% | $1,773.11 | |
| Jan-2006 | 9.4% | $1,770.78 | |
| Jan-2007 | 9.7% | $1,837.83 | |
| Jan-2008 | 9.7% | $1,828.57 | |
| Jan-2009 | 8.9% | $1,988.23 | |
| Jan-2010 | 8.9% | $2,011.95 | |
| Jan-2011 | 8.7% | $1,998.22 | |
| Jan-2012 | 9.1% | $2,077.86 |

Note: No formal data exists in the years between 1959 and 1966 for the percentage of elderly persons living in poverty. The dotted line denotes a linear extrapolation between the earliest data point (1959) and the beginning of the complete series (1966).
Source: Authors' analysis of Current Population Survey Annual Social and Economic Supplement Historical Poverty Tables (Table 2 and 3) and of U.S. Treasury (2009, Table 4a)
Previous chart: « Number of U.S. jobs created by ending currency manipulation, 2015*
Next chart: Poverty rate, actual and simulated, 1959–2012 »