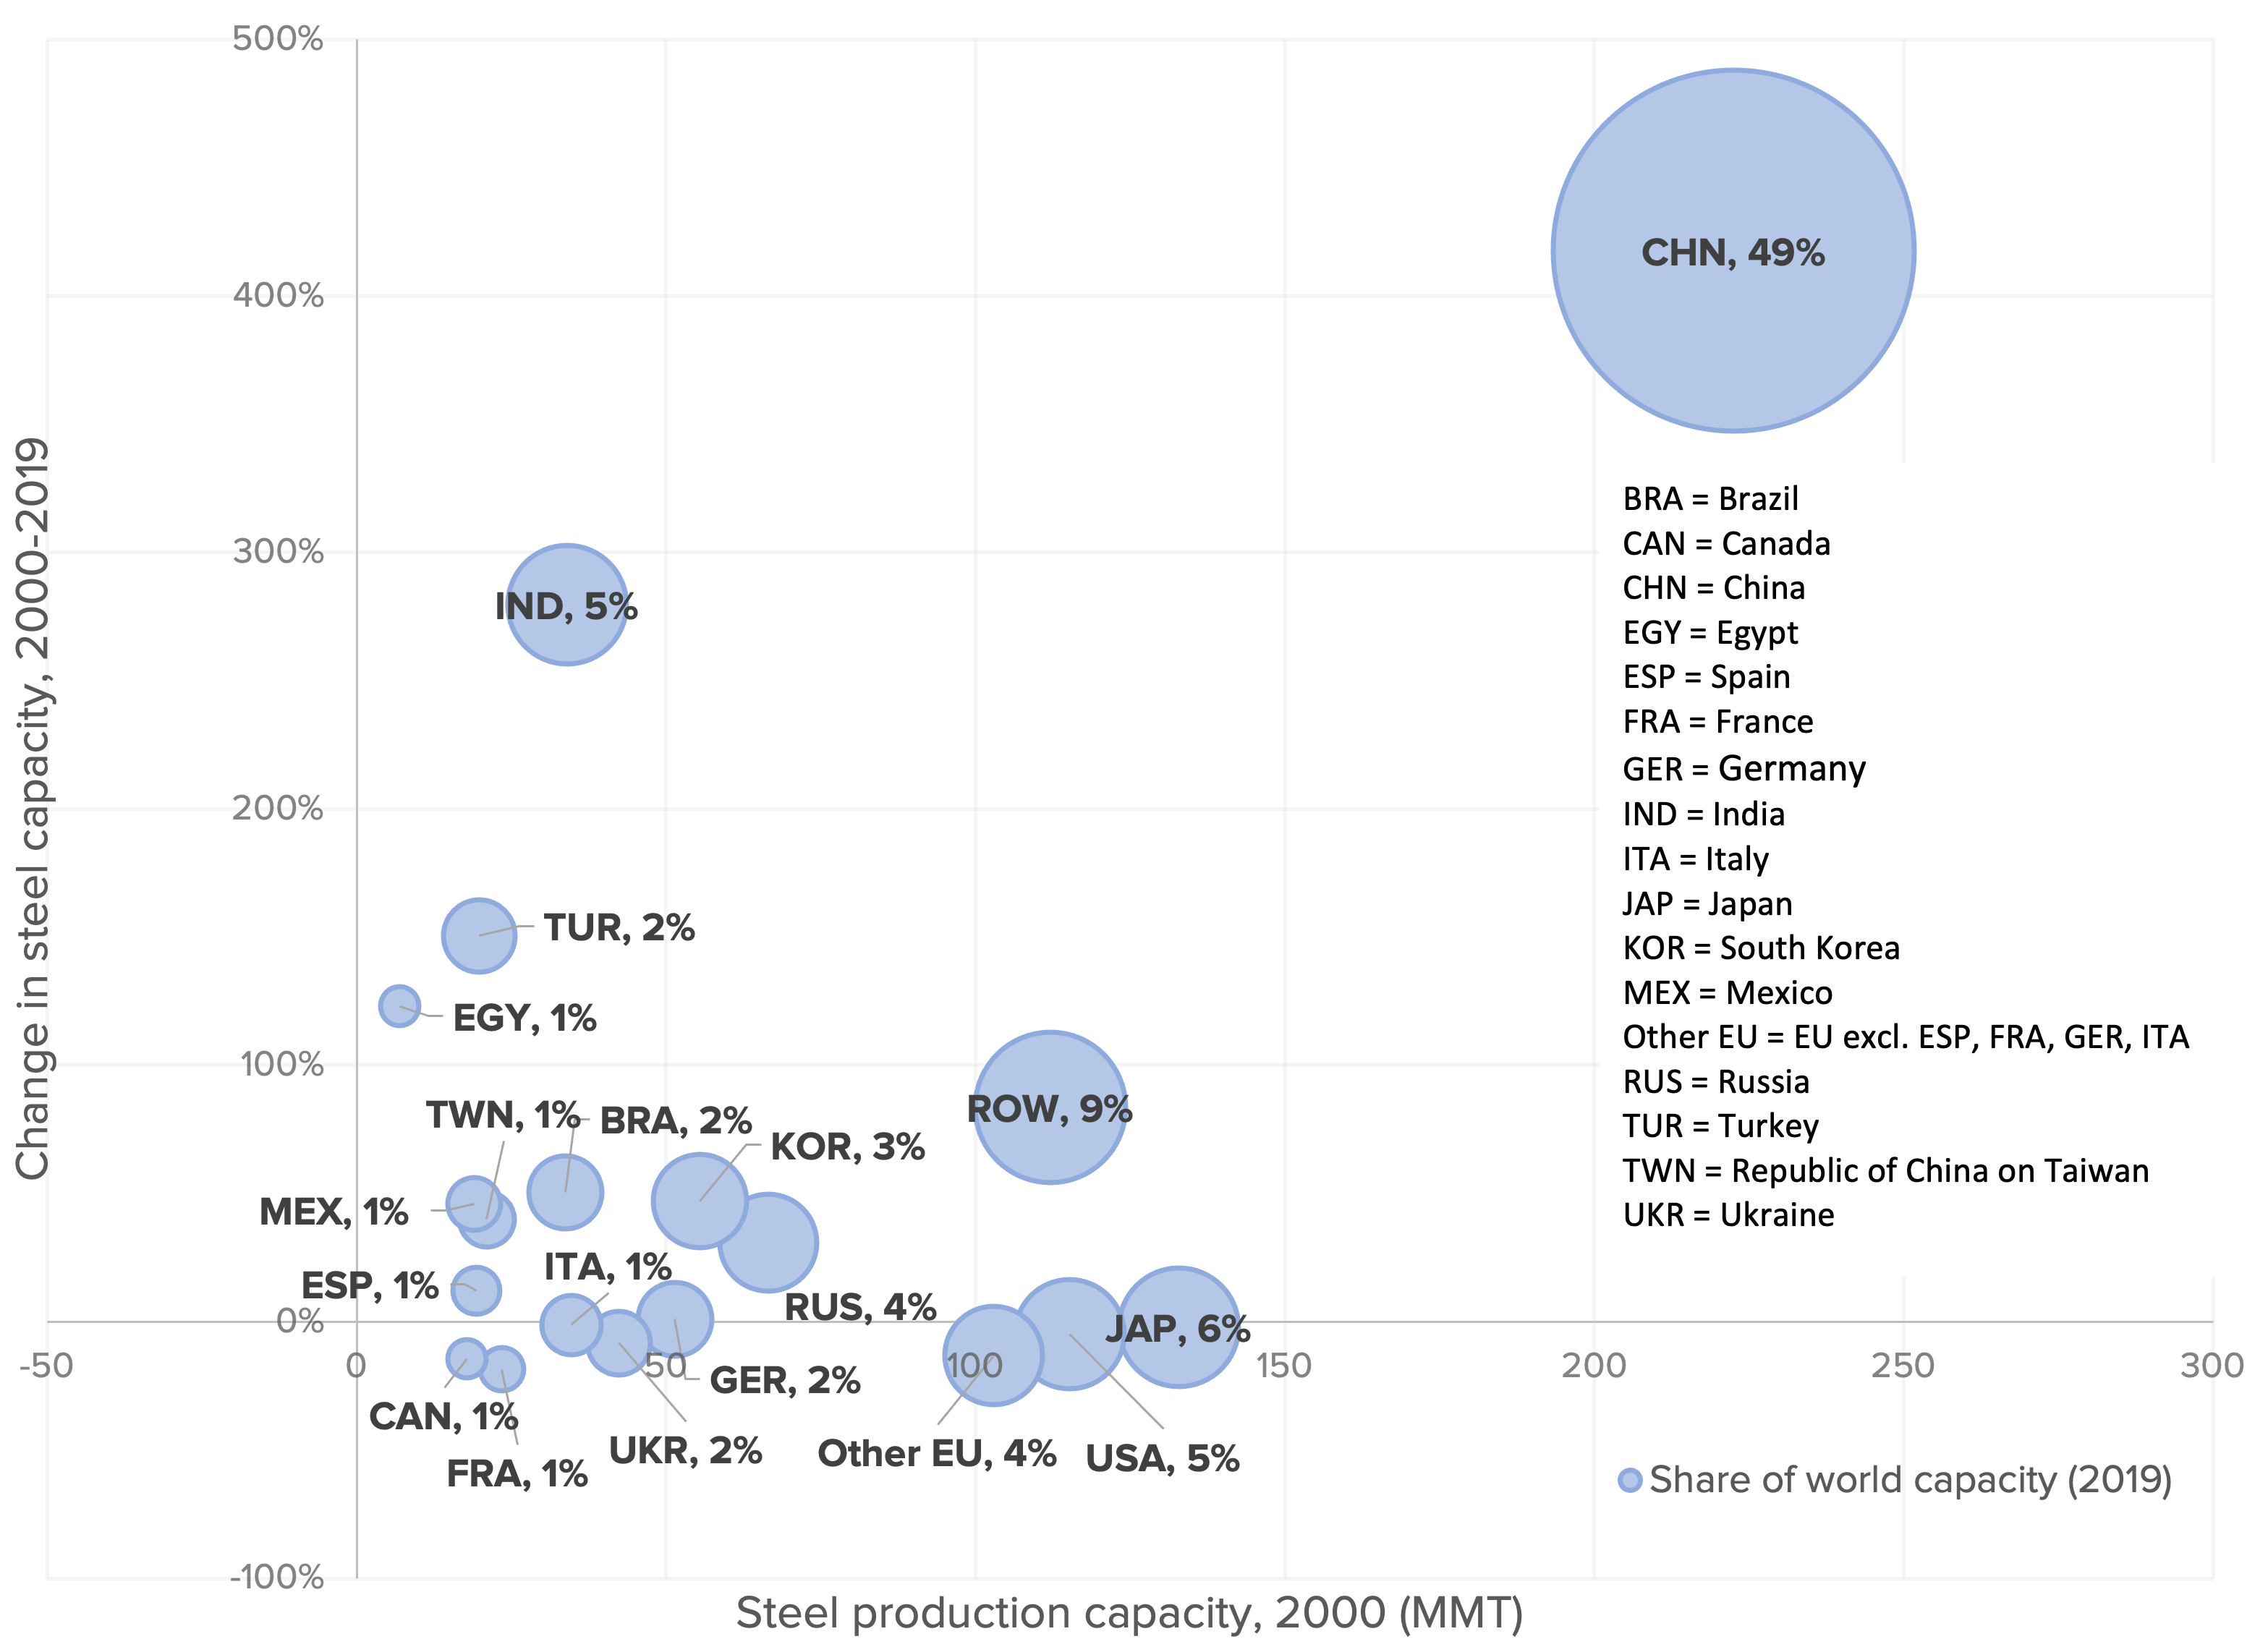
Figure BRapid expansion of steelmaking capacity in many countries threatens U.S. steel production: Change in steel capacity by country, 2000-2019Source: OECD (2020a) Share on Facebook Tweet this chart EmbedCopy the code below to embed this chart on your website.<iframe width="100%" height="460" src="https://www.epi.org?p=218899&view=embed&embed_template=charts_v2013_08_21&embed_date=20240414&onp=218899&utm_source=epi_press&utm_medium=chart_embed&utm_campaign=charts_v2" frameborder="0"></iframe> Download image Previous chart: « Union membership rate and share of income going to the middle 60 percent of families, 1917–2019 Next chart: A national $15 minimum wage would deliver wage increases to workers across the country: The impact of raising the federal minimum wage to $15 by 2025, by congressional district »