Figure B
Rapid expansion of steelmaking capacity in many countries threatens U.S. steel production: Change in steel capacity by country, 2000–2019
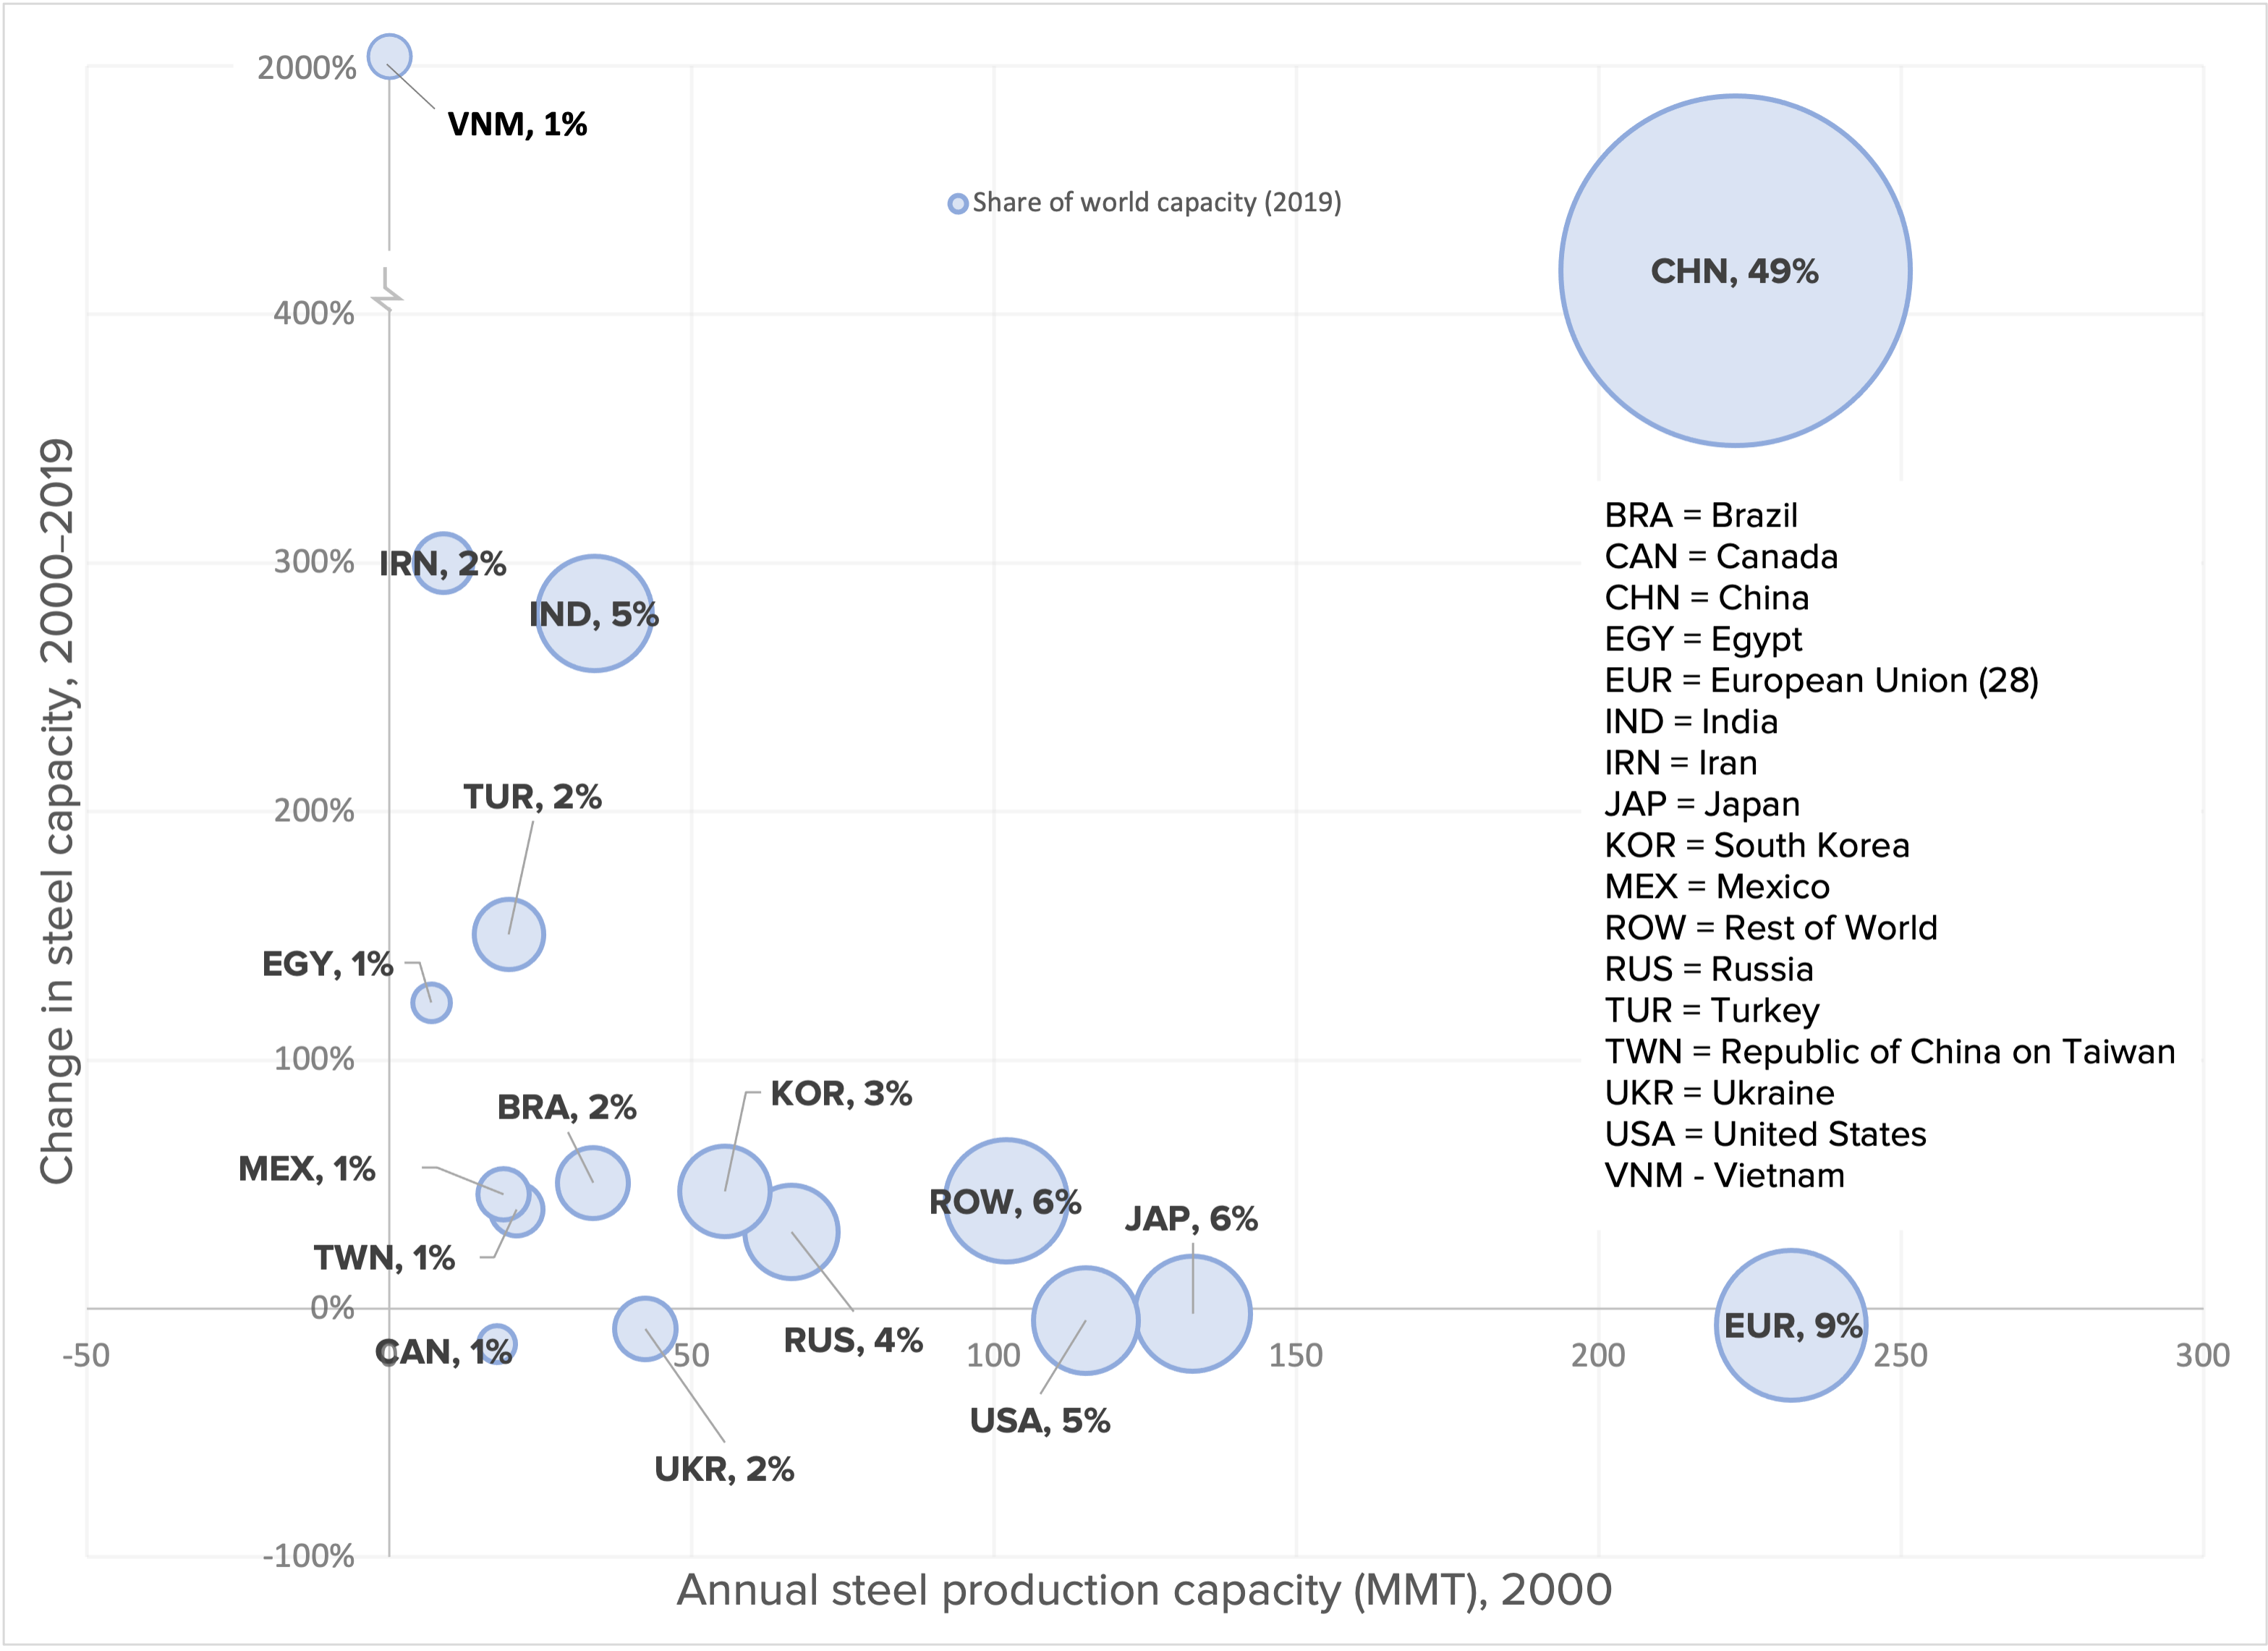
Note: The figure plots each country's steel production capacity in 2000 on the horizontal axis against the percentage growth in capacity from 2000 to 2019 on the vertical axis. The bubble sizes reflect each country’s relative share of global production capacity in 2019.
Source: OECD (2020a).
This chart appears in:
Previous chart: « Union coverage rate by age group, 2020
Next chart: Hourly wages of all workers, by wage percentile, selected years, 1979–2020 »