Mean and median savings in retirement accounts of households age 56–61, 1989–2010 (2010 dollars)
| Year | Mean savings** | Median/positive savings*** | Mean/positive savings* |
|---|---|---|---|
| 1989 | $54,666 | $40,480 | $105,463 |
| 1992 | $63,507 | $51,546 | $123,041 |
| 1995 | $74,886 | $38,241 | $139,593 |
| 1998 | $107,220 | $53,356 | $174,205 |
| 2001 | $144,976 | $61,268 | $224,958 |
| 2004 | $148,202 | $95,504 | $233,997 |
| 2007 | $197,710 | $111,054 | $298,897 |
| 2010 | $163,943 | $91,000 | $286,047 |
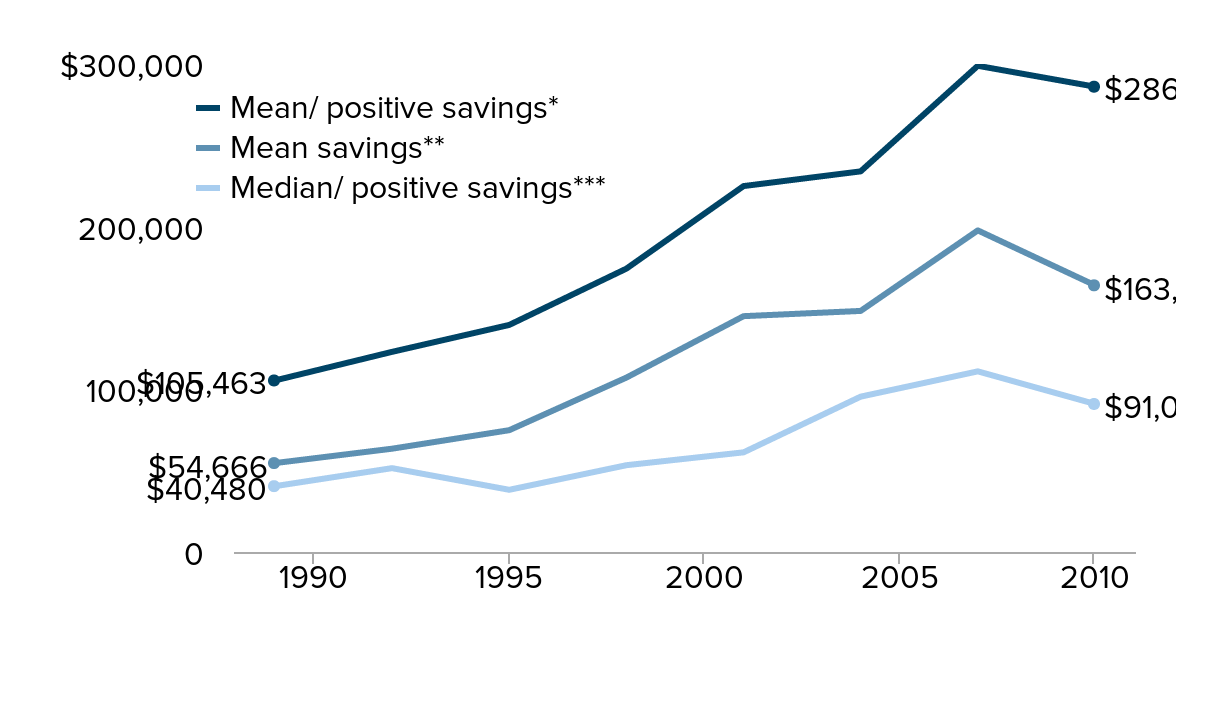
* Mean savings for households in specified age range with positive retirement account balances
** Mean savings for all households in specified age range
*** Median savings for households in specified age range with positive retirement account balances
Note: Retirement account savings include savings in 401(k) and other defined-contribution plans, IRAs (including employer-sponsored SEP IRAs and SIMPLE IRAs) and Keogh plans for small businesses.
Source: Authors' analysis of Survey of Consumer Finance microdata
Previous chart: « Share of workers age 26–61 participating in an employer-based retirement plan, 1989–2010
Next chart: Retirement account savings of households age 26–79 as a percent of income, by income fifth, 1989–2010 »