Figure G
Total federal spending under three scenarios of excess health care cost growth, 2015–2087
| Year | CBO alternative fiscal scenario (excess cost growth continues) | No excess cost growth | Excess cost growth cut in half |
|---|---|---|---|
| 2015 | 19.8% | 19.7% | 19.7% |
| 2016 | 19.7% | 19.5% | 19.6% |
| 2017 | 19.2% | 18.9% | 19.0% |
| 2018 | 18.9% | 18.5% | 18.7% |
| 2019 | 18.9% | 18.5% | 18.7% |
| 2020 | 18.9% | 18.4% | 18.6% |
| 2021 | 18.9% | 18.3% | 18.6% |
| 2022 | 19.1% | 18.4% | 18.7% |
| 2023 | 19.9% | 19.1% | 19.5% |
| 2024 | 20.4% | 19.5% | 19.9% |
| 2025 | 21.2% | 20.2% | 20.7% |
| 2026 | 21.7% | 20.6% | 21.1% |
| 2027 | 22.4% | 21.2% | 21.8% |
| 2028 | 22.7% | 21.4% | 22.0% |
| 2029 | 22.8% | 21.4% | 22.0% |
| 2030 | 22.9% | 21.4% | 22.1% |
| 2031 | 23.2% | 21.6% | 22.3% |
| 2032 | 23.3% | 21.6% | 22.4% |
| 2033 | 23.5% | 21.7% | 22.5% |
| 2034 | 23.7% | 21.8% | 22.6% |
| 2035 | 23.7% | 21.7% | 22.6% |
| 2036 | 23.9% | 21.8% | 22.7% |
| 2037 | 23.9% | 21.7% | 22.7% |
| 2038 | 24.2% | 21.8% | 22.9% |
| 2039 | 24.2% | 21.7% | 22.8% |
| 2040 | 24.3% | 21.7% | 22.8% |
| 2041 | 24.2% | 21.5% | 22.7% |
| 2042 | 24.4% | 21.6% | 22.8% |
| 2043 | 24.5% | 21.6% | 22.9% |
| 2044 | 24.6% | 21.6% | 22.9% |
| 2045 | 24.7% | 21.6% | 22.9% |
| 2046 | 24.8% | 21.6% | 23.0% |
| 2047 | 25.0% | 21.7% | 23.1% |
| 2048 | 25.0% | 21.6% | 23.0% |
| 2049 | 25.1% | 21.6% | 23.1% |
| 2050 | 25.3% | 21.6% | 23.2% |
| 2051 | 25.4% | 21.6% | 23.2% |
| 2052 | 25.5% | 21.6% | 23.3% |
| 2053 | 25.6% | 21.6% | 23.3% |
| 2054 | 25.6% | 21.5% | 23.2% |
| 2055 | 25.8% | 21.6% | 23.4% |
| 2056 | 26.0% | 21.7% | 23.5% |
| 2057 | 26.0% | 21.6% | 23.4% |
| 2058 | 26.1% | 21.6% | 23.5% |
| 2059 | 26.3% | 21.6% | 23.6% |
| 2060 | 26.4% | 21.6% | 23.6% |
| 2061 | 26.5% | 21.6% | 23.6% |
| 2062 | 26.6% | 21.6% | 23.7% |
| 2063 | 26.7% | 21.6% | 23.7% |
| 2064 | 26.8% | 21.6% | 23.7% |
| 2065 | 26.9% | 21.6% | 23.8% |
| 2066 | 27.0% | 21.6% | 23.8% |
| 2067 | 27.2% | 21.6% | 23.9% |
| 2068 | 27.1% | 21.4% | 23.7% |
| 2069 | 27.3% | 21.5% | 23.9% |
| 2070 | 27.4% | 21.5% | 23.9% |
| 2071 | 27.5% | 21.5% | 23.9% |
| 2072 | 27.6% | 21.5% | 23.9% |
| 2073 | 27.6% | 21.4% | 23.9% |
| 2074 | 27.7% | 21.3% | 23.9% |
| 2075 | 27.9% | 21.4% | 24.0% |
| 2076 | 27.9% | 21.3% | 23.9% |
| 2077 | 28.0% | 21.3% | 24.0% |
| 2078 | 28.1% | 21.3% | 24.0% |
| 2079 | 28.2% | 21.3% | 24.0% |
| 2080 | 28.3% | 21.2% | 24.0% |
| 2081 | 28.4% | 21.2% | 24.0% |
| 2082 | 28.4% | 21.1% | 24.0% |
| 2083 | 28.6% | 21.2% | 24.1% |
| 2084 | 28.6% | 21.1% | 24.0% |
| 2085 | 28.7% | 21.1% | 24.0% |
| 2086 | 28.6% | 20.9% | 23.9% |
| 2087 | 28.7% | 20.9% | 23.9% |
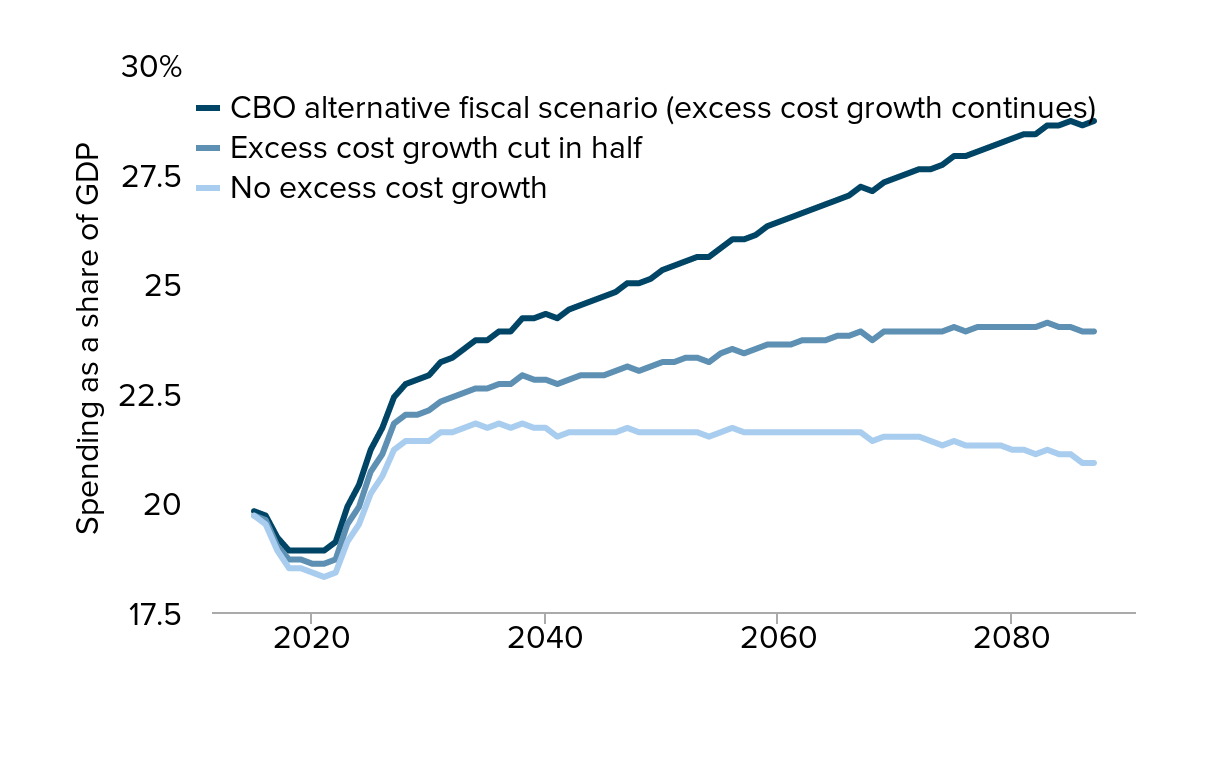
Note: Health care cost levels reflect trends in per enrollee health care costs.
Source: Authors' analysis of Congressional Budget Office (2012)
This chart appears in:
Previous chart: « Average middle-class income growth, actual and under two hypothetical scenarios, 1979–2007
Next chart: Tax rates on the broad middle class, 1979 and 2007 »