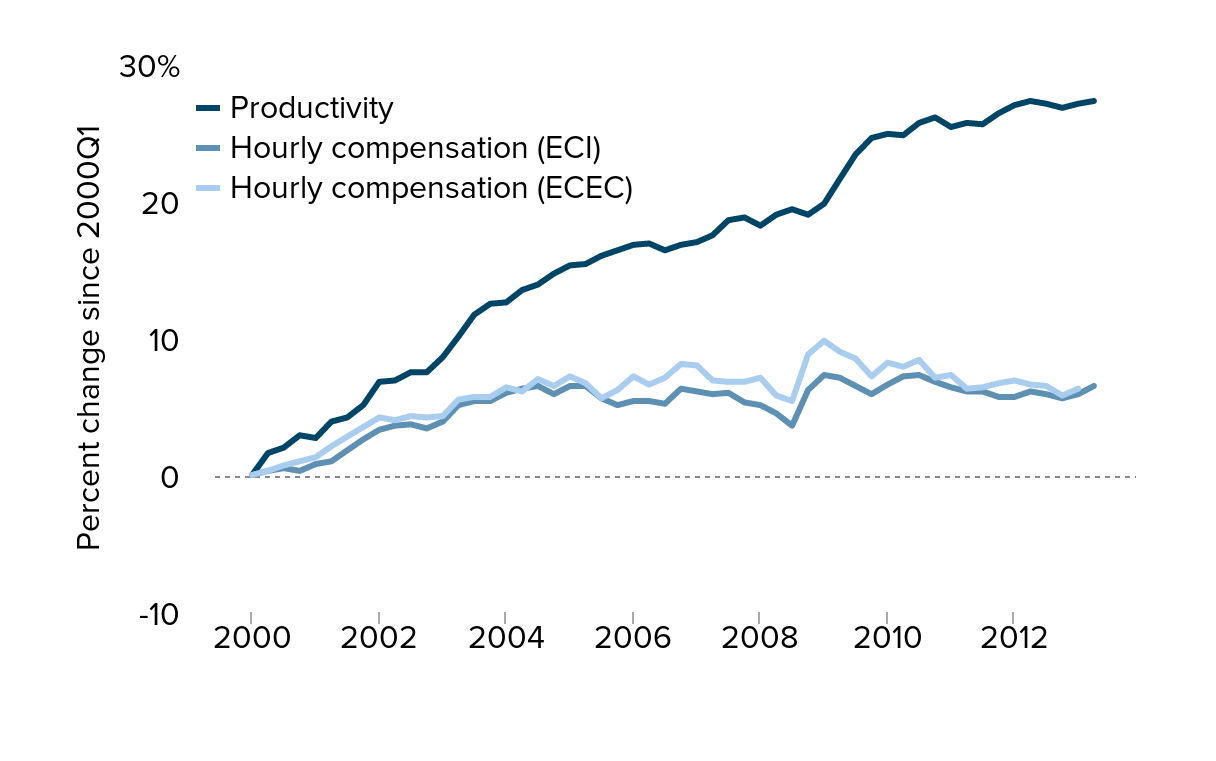
Figure A
Real average hourly compensation and productivity growth, 2000–2013
| Productivity | Hourly compensation (ECEC) | Hourly compensation (ECI) | |
|---|---|---|---|
| 2000-I | 0.0% | 0.0% | 0.0% |
| 2000-II | 1.6% | 0.3% | 0.3% |
| 2000-III | 2.0% | 0.7% | 0.5% |
| 2000-IV | 2.9% | 1.0% | 0.3% |
| 2001-I | 2.7% | 1.3% | 0.8% |
| 2001-II | 3.9% | 2.1% | 1.0% |
| 2001-III | 4.2% | 2.8% | 1.8% |
| 2001-IV | 5.1% | 3.5% | 2.6% |
| 2002-I | 6.8% | 4.2% | 3.3% |
| 2002-II | 6.9% | 4.0% | 3.6% |
| 2002-III | 7.5% | 4.3% | 3.7% |
| 2002-IV | 7.5% | 4.2% | 3.4% |
| 2003-I | 8.6% | 4.3% | 3.9% |
| 2003-II | 10.1% | 5.5% | 5.1% |
| 2003-III | 11.7% | 5.7% | 5.4% |
| 2003-IV | 12.5% | 5.7% | 5.4% |
| 2004-I | 12.6% | 6.4% | 6.0% |
| 2004-II | 13.5% | 6.1% | 6.3% |
| 2004-III | 13.9% | 7.0% | 6.5% |
| 2004-IV | 14.7% | 6.5% | 5.9% |
| 2005-I | 15.3% | 7.2% | 6.5% |
| 2005-II | 15.4% | 6.7% | 6.5% |
| 2005-III | 16.0% | 5.6% | 5.6% |
| 2005-IV | 16.4% | 6.2% | 5.1% |
| 2006-I | 16.8% | 7.2% | 5.4% |
| 2006-II | 16.9% | 6.6% | 5.4% |
| 2006-III | 16.4% | 7.1% | 5.2% |
| 2006-IV | 16.8% | 8.1% | 6.3% |
| 2007-I | 17.0% | 8.0% | 6.1% |
| 2007-II | 17.5% | 6.9% | 5.9% |
| 2007-III | 18.6% | 6.8% | 6.0% |
| 2007-IV | 18.8% | 6.8% | 5.3% |
| 2008-I | 18.2% | 7.1% | 5.1% |
| 2008-II | 19.0% | 5.8% | 4.5% |
| 2008-III | 19.4% | 5.4% | 3.6% |
| 2008-IV | 19.0% | 8.8% | 6.2% |
| 2009-I | 19.8% | 9.8% | 7.3% |
| 2009-II | 21.6% | 9.0% | 7.1% |
| 2009-III | 23.4% | 8.5% | 6.5% |
| 2009-IV | 24.6% | 7.2% | 5.9% |
| 2010-I | 24.9% | 8.2% | 6.6% |
| 2010-II | 24.8% | 7.9% | 7.2% |
| 2010-III | 25.7% | 8.4% | 7.3% |
| 2010-IV | 26.1% | 7.1% | 6.8% |
| 2011-I | 25.4% | 7.3% | 6.4% |
| 2011-II | 25.7% | 6.3% | 6.1% |
| 2011-III | 25.6% | 6.4% | 6.1% |
| 2011-IV | 26.4% | 6.7% | 5.7% |
| 2012-I | 27.0% | 6.9% | 5.7% |
| 2012-II | 27.3% | 6.6% | 6.1% |
| 2012-III | 27.1% | 6.5% | 5.9% |
| 2012-IV | 26.8% | 5.8% | 5.6% |
| 2013-I | 27.1% | 6.3% | 5.9% |
| 2013-II | 27.3% | 6.5% |

Note: Productivity series reflects the total economy, while ECI and ECEC reflect the compensation of all private workers. ECEC data are linearly interpolated between 2000Q1–2001Q1 and 2001Q1–2002Q1 (no formal data exist for quarters two, three, or four in 2000 or 2001). Only the ECI had data available for 2013Q2.
Source: Authors' analysis of the Bureau of Labor Statistics unpublished Total Economy Productivity data, and Employment Cost Index and Employer Costs for Employee Compensation public data series
This chart appears in:
Previous chart: « Real median weekly earnings of full-time workers, by gender and race, 1979–2013
Next chart: Real hourly private-sector compensation, by occupation, 2001–2013 »