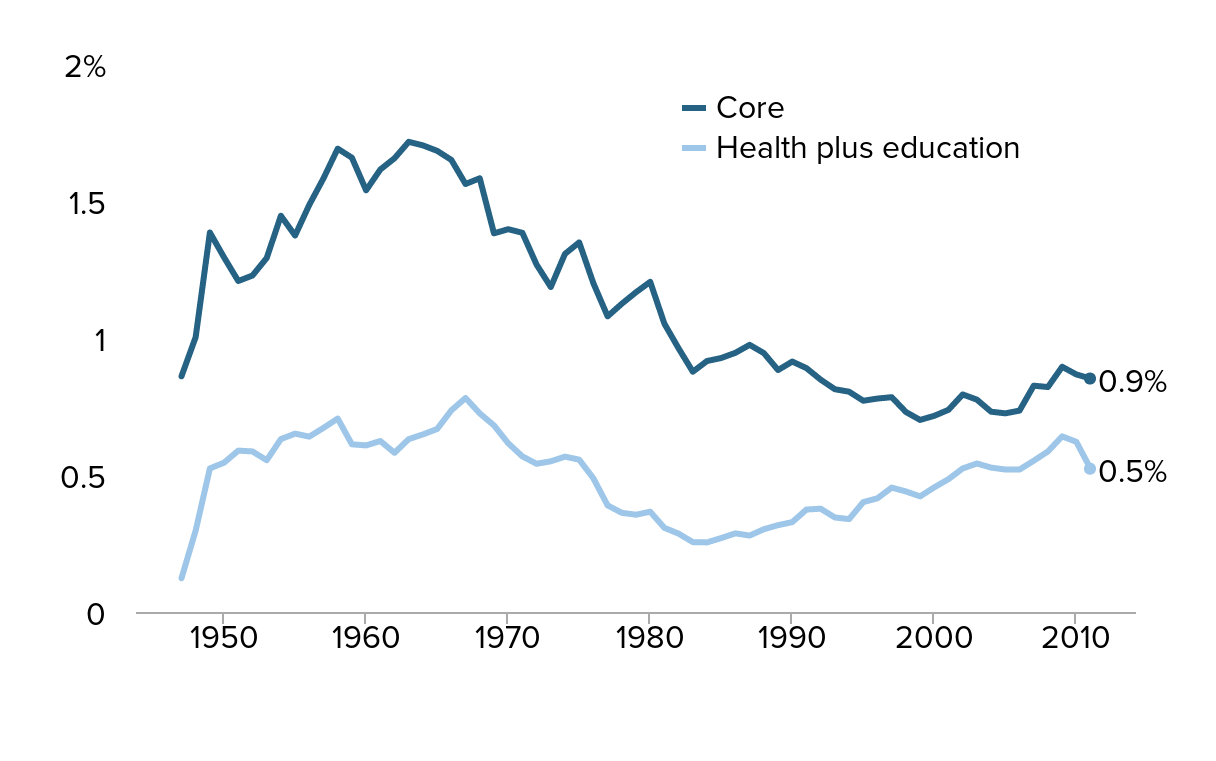
Figure F
"Core" infrastructure investments and health and education investments, as a share of GDP, 1947–2011
| Core | Health plus education | |
|---|---|---|
| 1947 | 0.860% | 0.123% |
| 1948 | 1.003% | 0.297% |
| 1949 | 1.385% | 0.524% |
| 1950 | 1.294% | 0.545% |
| 1951 | 1.208% | 0.589% |
| 1952 | 1.228% | 0.586% |
| 1953 | 1.292% | 0.554% |
| 1954 | 1.446% | 0.631% |
| 1955 | 1.374% | 0.651% |
| 1956 | 1.486% | 0.640% |
| 1957 | 1.583% | 0.672% |
| 1958 | 1.691% | 0.706% |
| 1959 | 1.658% | 0.612% |
| 1960 | 1.539% | 0.608% |
| 1961 | 1.615% | 0.624% |
| 1962 | 1.656% | 0.581% |
| 1963 | 1.716% | 0.631% |
| 1964 | 1.703% | 0.648% |
| 1965 | 1.683% | 0.668% |
| 1966 | 1.650% | 0.736% |
| 1967 | 1.562% | 0.781% |
| 1968 | 1.583% | 0.725% |
| 1969 | 1.382% | 0.681% |
| 1970 | 1.397% | 0.616% |
| 1971 | 1.384% | 0.568% |
| 1972 | 1.268% | 0.541% |
| 1973 | 1.186% | 0.550% |
| 1974 | 1.307% | 0.567% |
| 1975 | 1.349% | 0.556% |
| 1976 | 1.200% | 0.488% |
| 1977 | 1.079% | 0.389% |
| 1978 | 1.125% | 0.362% |
| 1979 | 1.167% | 0.355% |
| 1980 | 1.205% | 0.366% |
| 1981 | 1.052% | 0.307% |
| 1982 | 0.962% | 0.286% |
| 1983 | 0.877% | 0.255% |
| 1984 | 0.916% | 0.254% |
| 1985 | 0.927% | 0.270% |
| 1986 | 0.946% | 0.287% |
| 1987 | 0.975% | 0.279% |
| 1988 | 0.945% | 0.302% |
| 1989 | 0.883% | 0.317% |
| 1990 | 0.914% | 0.328% |
| 1991 | 0.890% | 0.374% |
| 1992 | 0.848% | 0.377% |
| 1993 | 0.813% | 0.345% |
| 1994 | 0.804% | 0.339% |
| 1995 | 0.771% | 0.401% |
| 1996 | 0.779% | 0.415% |
| 1997 | 0.784% | 0.454% |
| 1998 | 0.730% | 0.440% |
| 1999 | 0.701% | 0.422% |
| 2000 | 0.716% | 0.455% |
| 2001 | 0.738% | 0.485% |
| 2002 | 0.794% | 0.524% |
| 2003 | 0.775% | 0.542% |
| 2004 | 0.731% | 0.527% |
| 2005 | 0.725% | 0.520% |
| 2006 | 0.735% | 0.520% |
| 2007 | 0.826% | 0.552% |
| 2008 | 0.821% | 0.586% |
| 2009 | 0.895% | 0.641% |
| 2010 | 0.867% | 0.621% |
| 2011 | 0.852% | 0.523% |

Note: "Core" infrastructure is highway, transportation, sewer, and water-treatment investments.
Source: Author's analysis of Bureau of Economic Analysis National Income and Product Accounts (Tables 1.1.5, 5.8.5a, and 5.8.5b)
This chart appears in:
Previous chart: « Share of private and public capital stocks accounted for by equipment and software, 1947–2011
Next chart: Actual and implied nondefense public investment as a share of GDP in various budget proposals, 2000–2023 »