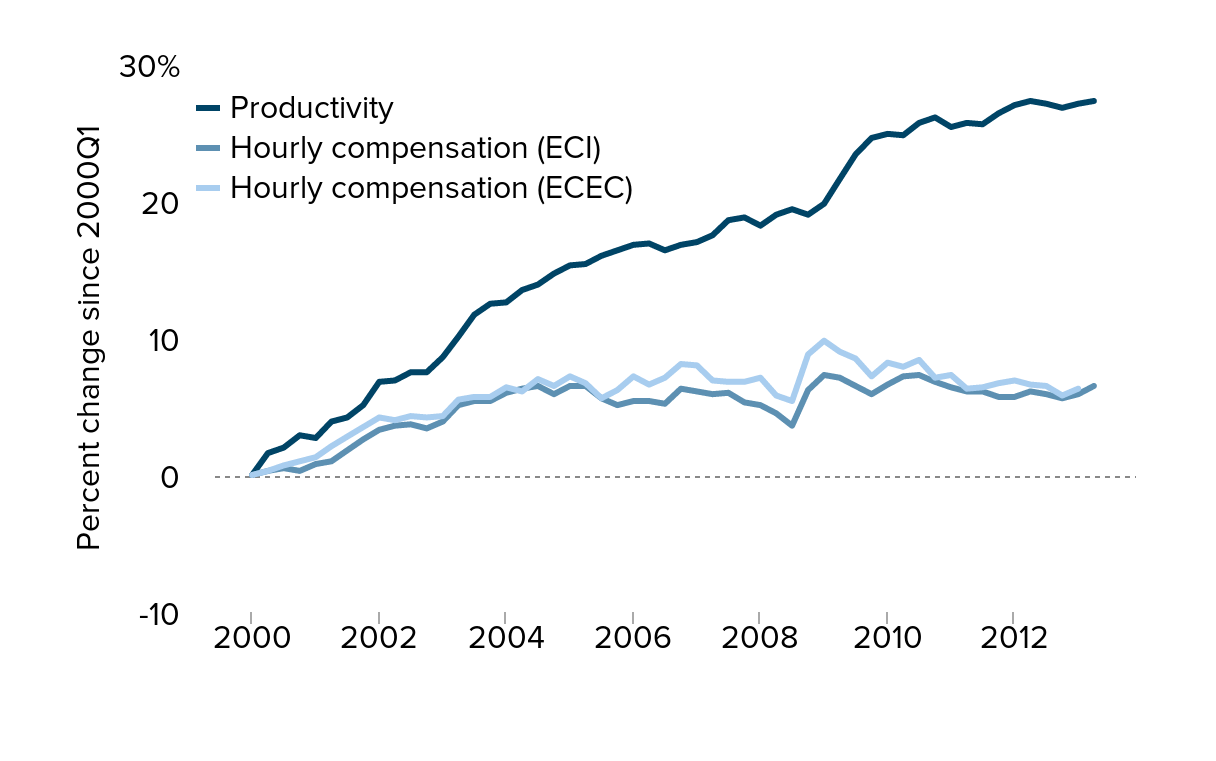
Figure A
Real average hourly compensation and productivity growth, 2000–2013
| Productivity | Hourly compensation (ECEC) | Hourly compensation (ECI) | |
|---|---|---|---|
| 2000-I | 0.0% | 0.0% | 0.0% |
| 2000-II | 1.6% | 0.3% | 0.3% |
| 2000-III | 2.0% | 0.7% | 0.5% |
| 2000-IV | 2.9% | 1.0% | 0.3% |
| 2001-I | 2.7% | 1.3% | 0.8% |
| 2001-II | 3.9% | 2.1% | 1.0% |
| 2001-III | 4.2% | 2.8% | 1.8% |
| 2001-IV | 5.1% | 3.5% | 2.6% |
| 2002-I | 6.8% | 4.2% | 3.3% |
| 2002-II | 6.9% | 4.0% | 3.6% |
| 2002-III | 7.5% | 4.3% | 3.7% |
| 2002-IV | 7.5% | 4.2% | 3.4% |
| 2003-I | 8.6% | 4.3% | 3.9% |
| 2003-II | 10.1% | 5.5% | 5.1% |
| 2003-III | 11.7% | 5.7% | 5.4% |
| 2003-IV | 12.5% | 5.7% | 5.4% |
| 2004-I | 12.6% | 6.4% | 6.0% |
| 2004-II | 13.5% | 6.1% | 6.3% |
| 2004-III | 13.9% | 7.0% | 6.5% |
| 2004-IV | 14.7% | 6.5% | 5.9% |
| 2005-I | 15.3% | 7.2% | 6.5% |
| 2005-II | 15.4% | 6.7% | 6.5% |
| 2005-III | 16.0% | 5.6% | 5.6% |
| 2005-IV | 16.4% | 6.2% | 5.1% |
| 2006-I | 16.8% | 7.2% | 5.4% |
| 2006-II | 16.9% | 6.6% | 5.4% |
| 2006-III | 16.4% | 7.1% | 5.2% |
| 2006-IV | 16.8% | 8.1% | 6.3% |
| 2007-I | 17.0% | 8.0% | 6.1% |
| 2007-II | 17.5% | 6.9% | 5.9% |
| 2007-III | 18.6% | 6.8% | 6.0% |
| 2007-IV | 18.8% | 6.8% | 5.3% |
| 2008-I | 18.2% | 7.1% | 5.1% |
| 2008-II | 19.0% | 5.8% | 4.5% |
| 2008-III | 19.4% | 5.4% | 3.6% |
| 2008-IV | 19.0% | 8.8% | 6.2% |
| 2009-I | 19.8% | 9.8% | 7.3% |
| 2009-II | 21.6% | 9.0% | 7.1% |
| 2009-III | 23.4% | 8.5% | 6.5% |
| 2009-IV | 24.6% | 7.2% | 5.9% |
| 2010-I | 24.9% | 8.2% | 6.6% |
| 2010-II | 24.8% | 7.9% | 7.2% |
| 2010-III | 25.7% | 8.4% | 7.3% |
| 2010-IV | 26.1% | 7.1% | 6.8% |
| 2011-I | 25.4% | 7.3% | 6.4% |
| 2011-II | 25.7% | 6.3% | 6.1% |
| 2011-III | 25.6% | 6.4% | 6.1% |
| 2011-IV | 26.4% | 6.7% | 5.7% |
| 2012-I | 27.0% | 6.9% | 5.7% |
| 2012-II | 27.3% | 6.6% | 6.1% |
| 2012-III | 27.1% | 6.5% | 5.9% |
| 2012-IV | 26.8% | 5.8% | 5.6% |
| 2013-I | 27.1% | 6.3% | 5.9% |
| 2013-II | 27.3% | 6.5% |

Note: Productivity series reflects total economy compensation while ECI and ECEC reflect the compensation for all private workers. The dotted line denotes a linear interpolation between 2000q1–2001q1 and 2001q1–2002q1 (no formal data exist for quarters two, three, or four in 2000 or 2001). Only the ECI had data available for 2013q2.
Source: Authors' analysis of the Bureau of Labor Statistics' unpublished Total Economy Productivity data, and Employment Cost Index and Employer Cost for Employee Compensation public data series
Previous chart: « RR March Paper chart 1
Next chart: Overall and composition-adjusted changes in upper-tail and lower-tail inequality, 1979–2007 »