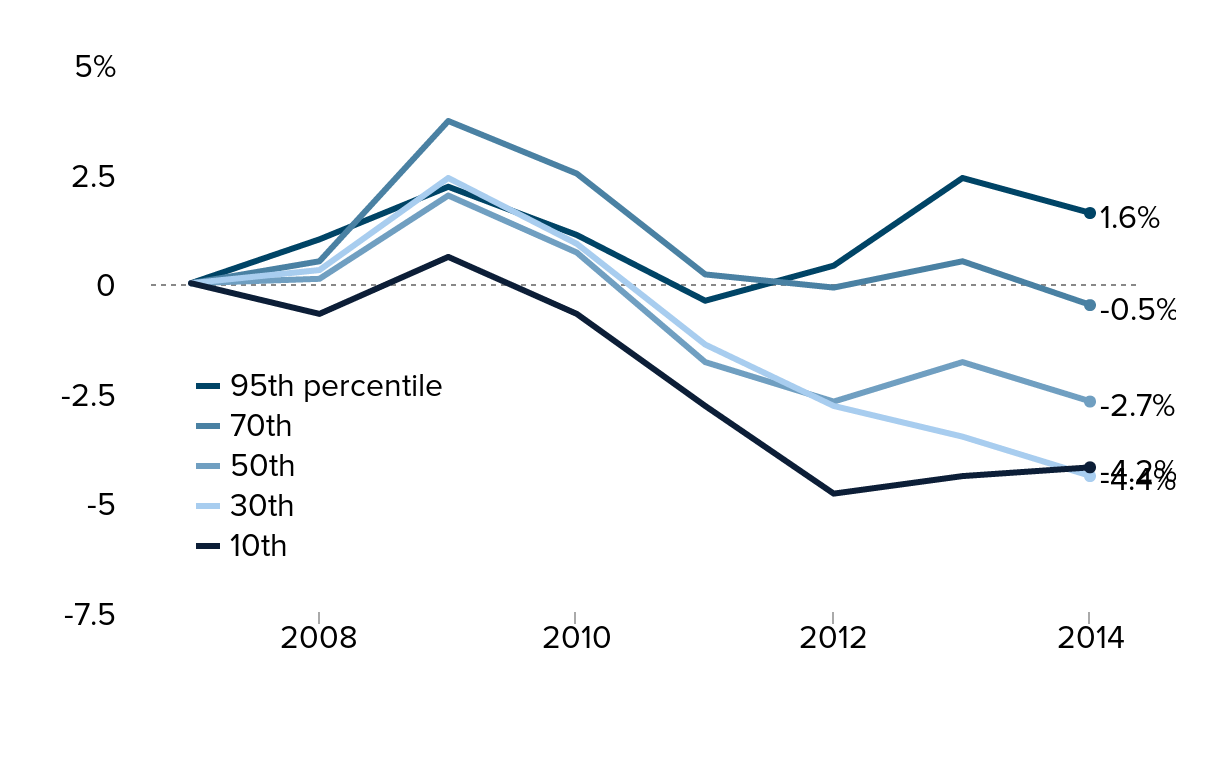
Wages for almost all workers have fallen in 2014: Cumulative growth in real hourly wages, by wage percentile, 2007–2014
| 10th | 30th | 50th | 70th | 95th percentile | |
|---|---|---|---|---|---|
| 2007 | 0.0% | 0.0% | 0.0% | 0.0% | 0.0% |
| 2008 | -0.7% | 0.3% | 0.1% | 0.5% | 1.0% |
| 2009 | 0.6% | 2.4% | 2.0% | 3.7% | 2.2% |
| 2010 | -0.7% | 0.9% | 0.7% | 2.5% | 1.1% |
| 2011 | -2.8% | -1.4% | -1.8% | 0.2% | -0.4% |
| 2012 | -4.8% | -2.8% | -2.7% | -0.1% | 0.4% |
| 2013 | -4.4% | -3.5% | -1.8% | 0.5% | 2.4% |
| 2014 | -4.2% | -4.4% | -2.7% | -0.5% | 1.6% |

Notes: Data reflect first half values for each year. The xth-percentile wage is the wage at which x% of wage earners earn less and (100–x)% earn more.
Source: Author's analysis of Current Population Survey Outgoing Rotation Group (ORG) microdata
This chart appears in:
Previous chart: « Public workers
Next chart: Age 16–24 »