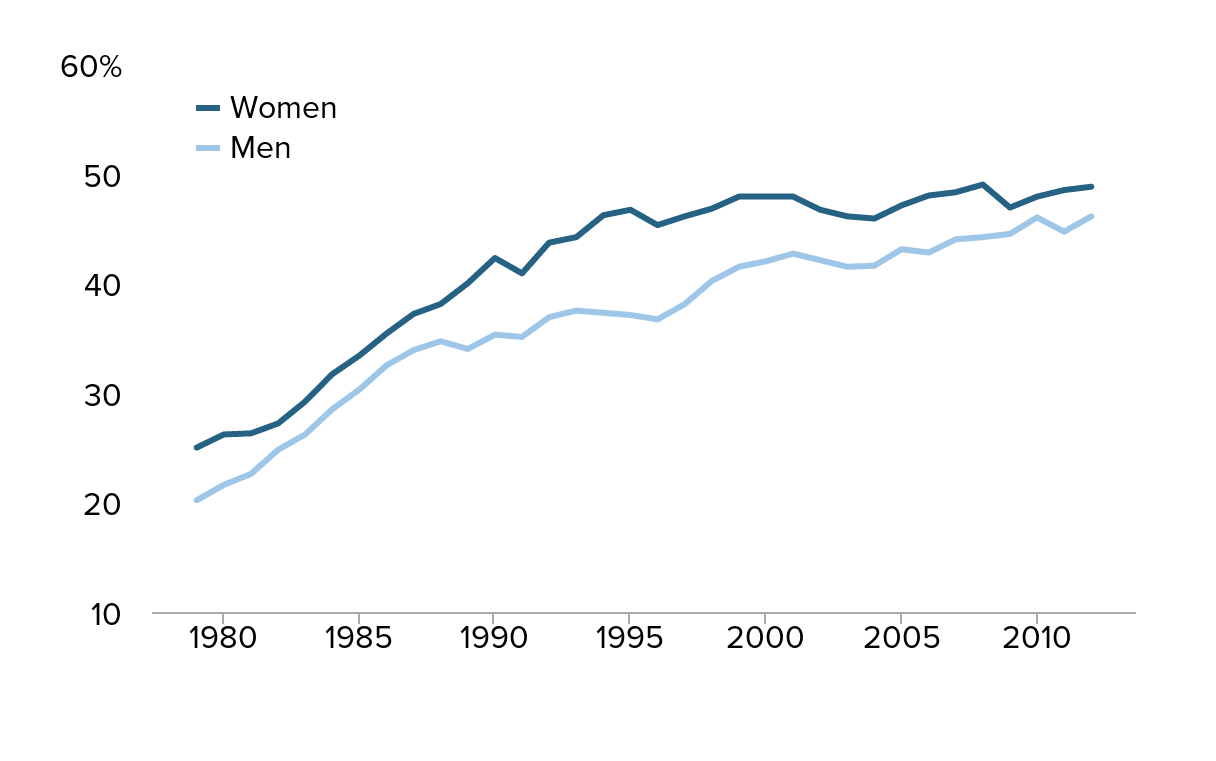
College wage premium,* by gender, 1979–2012
| Men | Women | |
|---|---|---|
| 1979 | 20.2% | 25.0% |
| 1980 | 21.6% | 26.2% |
| 1981 | 22.6% | 26.3% |
| 1982 | 24.8% | 27.2% |
| 1983 | 26.2% | 29.2% |
| 1984 | 28.5% | 31.7% |
| 1985 | 30.3% | 33.4% |
| 1986 | 32.5% | 35.4% |
| 1987 | 33.9% | 37.2% |
| 1988 | 34.7% | 38.1% |
| 1989 | 34.0% | 40.0% |
| 1990 | 35.3% | 42.3% |
| 1991 | 35.1% | 40.9% |
| 1992 | 36.9% | 43.7% |
| 1993 | 37.5% | 44.2% |
| 1994 | 37.3% | 46.2% |
| 1995 | 37.1% | 46.7% |
| 1996 | 36.7% | 45.3% |
| 1997 | 38.1% | 46.1% |
| 1998 | 40.2% | 46.8% |
| 1999 | 41.5% | 47.9% |
| 2000 | 42.0% | 47.9% |
| 2001 | 42.7% | 47.9% |
| 2002 | 42.1% | 46.7% |
| 2003 | 41.5% | 46.1% |
| 2004 | 41.6% | 45.9% |
| 2005 | 43.1% | 47.1% |
| 2006 | 42.8% | 48.0% |
| 2007 | 44.0% | 48.3% |
| 2008 | 44.2% | 49.0% |
| 2009 | 44.5% | 46.9% |
| 2010 | 46.0% | 47.9% |
| 2011 | 44.7% | 48.5% |
| 2012 | 46.1% | 48.8% |

* The premiums reflect the percent by which wages of four-year college graduates exceed those of otherwise equivalent high school graduates. In particular, the premiums are the coefficients on the “college” dummy in cross-sectional OLS regressions of log hourly wages on a quartic in age, dummies for region of the country (using the four major Census regions), a dummy for marital status, dummies for race/ethnicity (using mutually exclusive categories of white non-Hispanic, black non-Hispanic, Hispanic any race, and other), and dummies for education (less than high school, high school, some college, college, and advanced degree, where high school is the omitted category).
Source: Authors' analysis of Current Population Survey Outgoing Rotation Group microdata
This chart appears in:
Previous chart: « Real average hourly wage growth, by education, 2000–2012
Next chart: Table of generation labels, Silent Generation to Boomers to GenX/GenY »