What to Watch on Jobs Day: Beyond the headline numbers
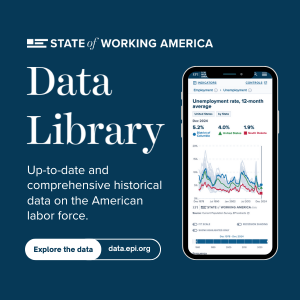
While we eagerly await the top line numbers in the Employment Situation Report every month, here at EPI, we also try to look under the hood and compare how various demographic groups are faring. As part of our effort to present a clear, accessible, and in-depth view of the economy and how it affects the workers in it, we’re launching EPI’s State of Working America Data Library. Right now, it’s got a great set of data on the labor force, but it’s going to be continually updated and expanded to include lots more.
Within the library, you can find up-to-date labor force statistics, including the unemployment rate, the long-term unemployment rate, the underemployment rate, the labor force participation rate, and the employment-to-population ratio. Not only do we provide a historical series back to 1979, but you can also sort the data by your variable of choice and download it as an Excel file. Within each series, we’ve disaggregated the data by various demographic groups and education categories. For example, you can find a consistent data series on the unemployment rate of prime-age black male workers, or the underemployment rate of young Hispanic female workers, or the long-term unemployment rate of white men, 55-64 years old. You can also examine the data by gender, race, and educational attainment at the same time—looking at labor force statistics such as the prime-age employment-to-population ratio for high school educated white women or the labor force participation rate of black men with an advanced degree.
For those who want a bit more detail, I should tell you that we report all the data in this section as 12-month moving averages. This is necessary for two reasons. One, some of the subcategories have relatively small sample sizes that require aggregation to get meaningful and reliable estimates. Two, it eliminates the need to seasonally adjust all our micro-data. So any data point can be compared to any other without those concerns.
In the library, you can also find a great deal of data on wages. Average wages, median wages, wages at the 10th percentile, wages at the 95th percentile, and all the deciles in between. Plus, wages by educational attainment. Also, wages for women, for men, for black workers, white workers, Hispanic workers, young workers, prime-age workers, older workers. Independently and in combination: for example, wages for young, female, black workers or prime-age, male, Hispanic workers.
Can you tell how excited I am to be telling you about the data? I know, it’s hard to hide. And, I haven’t even gotten to the best part. We have wage gaps—averages, medians, and regression-based wage gaps. We have the gender wage gap by race and racial wage gaps by gender. And, we have the college premium and the less than high school penalty. All of the wage data is provided on an annual basis to ensure reliability, comparability, and accuracy.
You should also know that it’s a work in progress. Not only will the data on employment and labor force statistics be updated monthly and the wage data will be updated annually, but also we are going to be regularly adding more and more data on workers, wages, incomes, poverty, wealth—all data that goes into our State of Working America analysis. We are creating a clearinghouse of EPI’s best data for use by researchers, journalists, policymakers, and the general public. We’re putting it all out there to answer lots of questions, ask new ones, and help find solutions.
On jobs day tomorrow, I will examine my favorite top line numbers: payroll employment, the prime-age employment-to-population ratio, and year-over-year nominal wage growth as the economy continues to move towards full employment. But, I’m also going to keep in mind the diverse groups of people behind those numbers, people, across the board, who depend on a strong and growing economy to increase their standard of living.
Enjoyed this post?
Sign up for EPI's newsletter so you never miss our research and insights on ways to make the economy work better for everyone.
