The Drop in the Unemployment Rate Is Not a Sign the Tides are Turning
While job growth was decent in June (though the downward revisions to April and May were disappointing), the news on unemployment was actually less welcome. This might seem odd to say given that the unemployment rate dropped from 5.5 to 5.3 percent. But this drop in unemployment was not primarily driven by a rise in employment; instead it was mostly due to a drop in the labor force.
Here’s a breakdown of the data. In June, the number of unemployed workers fell by 375,000. Good news, right? Not so much. The labor force dropped by more than that amount, a fall of 432,000. The White House suggests the weaker numbers may be driven by the earlier-than-normal reference period, which might not be picking up as much as the usual June increase in summer employment, which is largely driven by youth employment. So, let’s turn to the prime-age workforce to get rid of those trends, which primarily affect younger workers and which also get rid of any declines driven by baby boomer retirement.
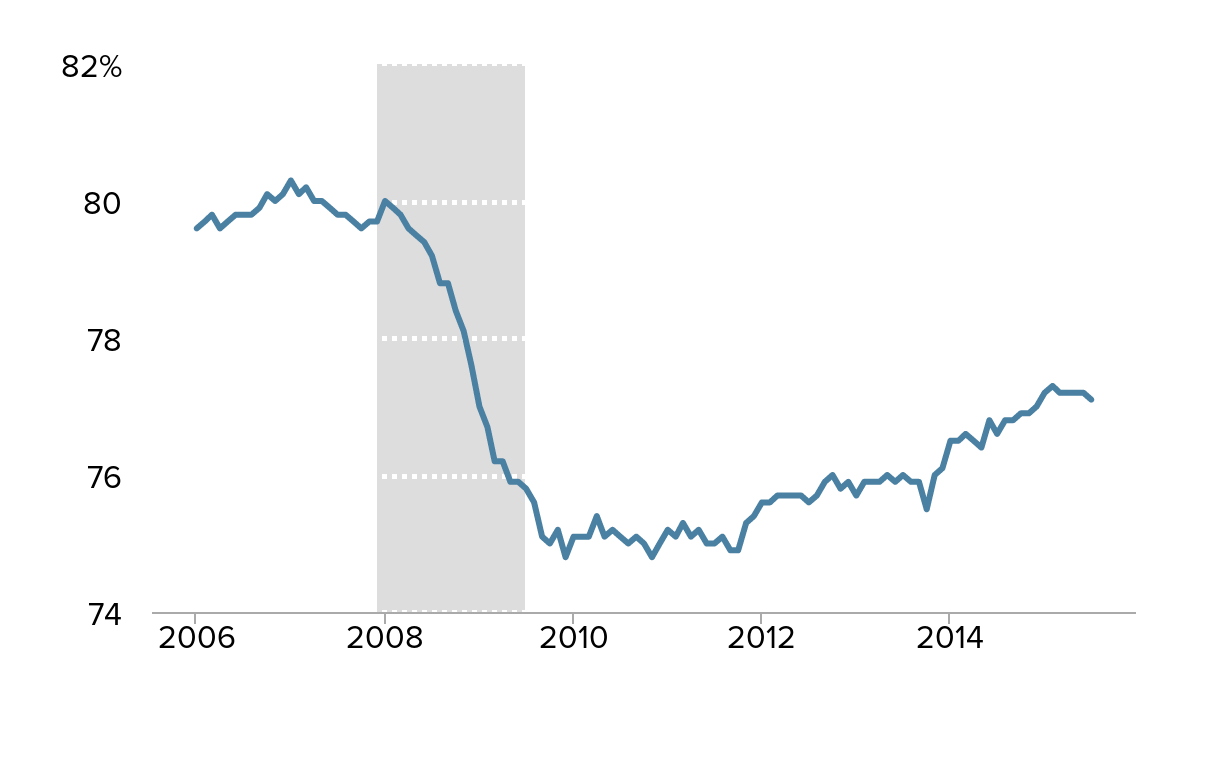
The prime-age employment-to-population (EPOP) ratio has been flat for the last four months at 77.2 percent. One would expect an improving economy to drive the prime-age EPOP upwards, and between October 2013 and February 2015 there was steady and decent progress on this front. But the recent stagnation has left prime-age EPOPs still far from fully recovered.
Employment-to-population ratio of workers ages 25-54, 2006-2015
| Month | Employment-to-population ratio |
|---|---|
| 2006-01-01 | 79.6% |
| 2006-02-01 | 79.7% |
| 2006-03-01 | 79.8% |
| 2006-04-01 | 79.6% |
| 2006-05-01 | 79.7% |
| 2006-06-01 | 79.8% |
| 2006-07-01 | 79.8% |
| 2006-08-01 | 79.8% |
| 2006-09-01 | 79.9% |
| 2006-10-01 | 80.1% |
| 2006-11-01 | 80.0% |
| 2006-12-01 | 80.1% |
| 2007-01-01 | 80.3% |
| 2007-02-01 | 80.1% |
| 2007-03-01 | 80.2% |
| 2007-04-01 | 80.0% |
| 2007-05-01 | 80.0% |
| 2007-06-01 | 79.9% |
| 2007-07-01 | 79.8% |
| 2007-08-01 | 79.8% |
| 2007-09-01 | 79.7% |
| 2007-10-01 | 79.6% |
| 2007-11-01 | 79.7% |
| 2007-12-01 | 79.7% |
| 2008-01-01 | 80.0% |
| 2008-02-01 | 79.9% |
| 2008-03-01 | 79.8% |
| 2008-04-01 | 79.6% |
| 2008-05-01 | 79.5% |
| 2008-06-01 | 79.4% |
| 2008-07-01 | 79.2% |
| 2008-08-01 | 78.8% |
| 2008-09-01 | 78.8% |
| 2008-10-01 | 78.4% |
| 2008-11-01 | 78.1% |
| 2008-12-01 | 77.6% |
| 2009-01-01 | 77.0% |
| 2009-02-01 | 76.7% |
| 2009-03-01 | 76.2% |
| 2009-04-01 | 76.2% |
| 2009-05-01 | 75.9% |
| 2009-06-01 | 75.9% |
| 2009-07-01 | 75.8% |
| 2009-08-01 | 75.6% |
| 2009-09-01 | 75.1% |
| 2009-10-01 | 75.0% |
| 2009-11-01 | 75.2% |
| 2009-12-01 | 74.8% |
| 2010-01-01 | 75.1% |
| 2010-02-01 | 75.1% |
| 2010-03-01 | 75.1% |
| 2010-04-01 | 75.4% |
| 2010-05-01 | 75.1% |
| 2010-06-01 | 75.2% |
| 2010-07-01 | 75.1% |
| 2010-08-01 | 75.0% |
| 2010-09-01 | 75.1% |
| 2010-10-01 | 75.0% |
| 2010-11-01 | 74.8% |
| 2010-12-01 | 75.0% |
| 2011-01-01 | 75.2% |
| 2011-02-01 | 75.1% |
| 2011-03-01 | 75.3% |
| 2011-04-01 | 75.1% |
| 2011-05-01 | 75.2% |
| 2011-06-01 | 75.0% |
| 2011-07-01 | 75.0% |
| 2011-08-01 | 75.1% |
| 2011-09-01 | 74.9% |
| 2011-10-01 | 74.9% |
| 2011-11-01 | 75.3% |
| 2011-12-01 | 75.4% |
| 2012-01-01 | 75.6% |
| 2012-02-01 | 75.6% |
| 2012-03-01 | 75.7% |
| 2012-04-01 | 75.7% |
| 2012-05-01 | 75.7% |
| 2012-06-01 | 75.7% |
| 2012-07-01 | 75.6% |
| 2012-08-01 | 75.7% |
| 2012-09-01 | 75.9% |
| 2012-10-01 | 76.0% |
| 2012-11-01 | 75.8% |
| 2012-12-01 | 75.9% |
| 2013-01-01 | 75.7% |
| 2013-02-01 | 75.9% |
| 2013-03-01 | 75.9% |
| 2013-04-01 | 75.9% |
| 2013-05-01 | 76.0% |
| 2013-06-01 | 75.9% |
| 2013-07-01 | 76.0% |
| 2013-08-01 | 75.9% |
| 2013-09-01 | 75.9% |
| 2013-10-01 | 75.5% |
| 2013-11-01 | 76.0% |
| 2013-12-01 | 76.1% |
| 2014-01-01 | 76.5% |
| 2014-02-01 | 76.5% |
| 2014-03-01 | 76.6% |
| 2014-04-01 | 76.5% |
| 2014-05-01 | 76.4% |
| 2014-06-01 | 76.8% |
| 2014-07-01 | 76.6% |
| 2014-08-01 | 76.8% |
| 2014-09-01 | 76.8% |
| 2014-10-01 | 76.9% |
| 2014-11-01 | 76.9% |
| 2014-12-01 | 77.0% |
| 2015-01-01 | 77.2% |
| 2015-02-01 | 77.3% |
| 2015-03-01 | 77.2% |
| 2015-04-01 | 77.2% |
| 2015-05-01 | 77.2% |
| 2015-06-01 | 77.2% |
| 2015-07-01 | 77.1% |
Source: EPI analysis of Bureau of Labor Statistics' Current Population Survey public data
Given the fact that prime-age EPOPs continue to be stuck in the doldrums, the drop in the unemployment rate for these workers may come as a surprise. The prime-age unemployment rate actually fell more than the overall, from 4.7 to 4.4 percent. This translates into a drop in the number of prime-age workers unemployed by 357,000. So, then something else must be explaining this trend since the EPOPs haven’t improved. For the explanation, we once again turn to trends in the labor force. The prime-age labor force fell by 245,000 in June. In percent terms, this was a drop in the labor force participation rate from 81.0 percent to 80.8 percent, almost completely explaining the fall in the unemployment rate.
Labor force participation rate of 25-54 year olds, 2000-2015
| Date | 25-54 LFPR |
|---|---|
| 2000-01-01 | 84.4% |
| 2000-02-01 | 84.4% |
| 2000-03-01 | 84.3% |
| 2000-04-01 | 84.4% |
| 2000-05-01 | 84.1% |
| 2000-06-01 | 84.1% |
| 2000-07-01 | 83.9% |
| 2000-08-01 | 83.8% |
| 2000-09-01 | 83.7% |
| 2000-10-01 | 83.6% |
| 2000-11-01 | 83.8% |
| 2000-12-01 | 83.9% |
| 2001-01-01 | 84.1% |
| 2001-02-01 | 84.1% |
| 2001-03-01 | 84.1% |
| 2001-04-01 | 83.7% |
| 2001-05-01 | 83.8% |
| 2001-06-01 | 83.6% |
| 2001-07-01 | 83.6% |
| 2001-08-01 | 83.5% |
| 2001-09-01 | 83.5% |
| 2001-10-01 | 83.6% |
| 2001-11-01 | 83.5% |
| 2001-12-01 | 83.7% |
| 2002-01-01 | 83.5% |
| 2002-02-01 | 83.7% |
| 2002-03-01 | 83.5% |
| 2002-04-01 | 83.6% |
| 2002-05-01 | 83.6% |
| 2002-06-01 | 83.2% |
| 2002-07-01 | 83.1% |
| 2002-08-01 | 83.2% |
| 2002-09-01 | 83.3% |
| 2002-10-01 | 83.2% |
| 2002-11-01 | 82.9% |
| 2002-12-01 | 83.1% |
| 2003-01-01 | 82.9% |
| 2003-02-01 | 83.0% |
| 2003-03-01 | 83.1% |
| 2003-04-01 | 83.2% |
| 2003-05-01 | 83.1% |
| 2003-06-01 | 83.3% |
| 2003-07-01 | 83.0% |
| 2003-08-01 | 83.0% |
| 2003-09-01 | 82.8% |
| 2003-10-01 | 82.9% |
| 2003-11-01 | 82.8% |
| 2003-12-01 | 82.8% |
| 2004-01-01 | 82.8% |
| 2004-02-01 | 82.7% |
| 2004-03-01 | 82.8% |
| 2004-04-01 | 82.7% |
| 2004-05-01 | 82.8% |
| 2004-06-01 | 82.9% |
| 2004-07-01 | 83.0% |
| 2004-08-01 | 82.7% |
| 2004-09-01 | 82.7% |
| 2004-10-01 | 82.6% |
| 2004-11-01 | 82.7% |
| 2004-12-01 | 82.6% |
| 2005-01-01 | 82.7% |
| 2005-02-01 | 82.8% |
| 2005-03-01 | 82.6% |
| 2005-04-01 | 82.7% |
| 2005-05-01 | 82.9% |
| 2005-06-01 | 82.6% |
| 2005-07-01 | 82.8% |
| 2005-08-01 | 82.9% |
| 2005-09-01 | 82.9% |
| 2005-10-01 | 82.7% |
| 2005-11-01 | 82.7% |
| 2005-12-01 | 82.7% |
| 2006-01-01 | 82.8% |
| 2006-02-01 | 82.9% |
| 2006-03-01 | 83.0% |
| 2006-04-01 | 82.8% |
| 2006-05-01 | 82.8% |
| 2006-06-01 | 82.8% |
| 2006-07-01 | 83.0% |
| 2006-08-01 | 82.9% |
| 2006-09-01 | 82.9% |
| 2006-10-01 | 82.9% |
| 2006-11-01 | 83.0% |
| 2006-12-01 | 83.1% |
| 2007-01-01 | 83.4% |
| 2007-02-01 | 83.2% |
| 2007-03-01 | 83.2% |
| 2007-04-01 | 83.0% |
| 2007-05-01 | 83.0% |
| 2007-06-01 | 82.9% |
| 2007-07-01 | 82.9% |
| 2007-08-01 | 82.9% |
| 2007-09-01 | 82.8% |
| 2007-10-01 | 82.7% |
| 2007-11-01 | 82.9% |
| 2007-12-01 | 83.1% |
| 2008-01-01 | 83.3% |
| 2008-02-01 | 83.2% |
| 2008-03-01 | 83.3% |
| 2008-04-01 | 83.1% |
| 2008-05-01 | 83.1% |
| 2008-06-01 | 83.1% |
| 2008-07-01 | 83.1% |
| 2008-08-01 | 83.2% |
| 2008-09-01 | 83.1% |
| 2008-10-01 | 83.0% |
| 2008-11-01 | 83.0% |
| 2008-12-01 | 82.8% |
| 2009-01-01 | 82.8% |
| 2009-02-01 | 82.8% |
| 2009-03-01 | 82.6% |
| 2009-04-01 | 82.8% |
| 2009-05-01 | 82.9% |
| 2009-06-01 | 82.9% |
| 2009-07-01 | 82.8% |
| 2009-08-01 | 82.8% |
| 2009-09-01 | 82.5% |
| 2009-10-01 | 82.5% |
| 2009-11-01 | 82.4% |
| 2009-12-01 | 82.0% |
| 2010-01-01 | 82.4% |
| 2010-02-01 | 82.3% |
| 2010-03-01 | 82.4% |
| 2010-04-01 | 82.6% |
| 2010-05-01 | 82.3% |
| 2010-06-01 | 82.2% |
| 2010-07-01 | 81.9% |
| 2010-08-01 | 82.0% |
| 2010-09-01 | 82.0% |
| 2010-10-01 | 81.8% |
| 2010-11-01 | 82.0% |
| 2010-12-01 | 81.9% |
| 2011-01-01 | 81.7% |
| 2011-02-01 | 81.6% |
| 2011-03-01 | 81.7% |
| 2011-04-01 | 81.7% |
| 2011-05-01 | 81.8% |
| 2011-06-01 | 81.7% |
| 2011-07-01 | 81.5% |
| 2011-08-01 | 81.6% |
| 2011-09-01 | 81.5% |
| 2011-10-01 | 81.3% |
| 2011-11-01 | 81.5% |
| 2011-12-01 | 81.6% |
| 2012-01-01 | 81.6% |
| 2012-02-01 | 81.5% |
| 2012-03-01 | 81.5% |
| 2012-04-01 | 81.4% |
| 2012-05-01 | 81.5% |
| 2012-06-01 | 81.5% |
| 2012-07-01 | 81.4% |
| 2012-08-01 | 81.4% |
| 2012-09-01 | 81.4% |
| 2012-10-01 | 81.6% |
| 2012-11-01 | 81.2% |
| 2012-12-01 | 81.4% |
| 2013-01-01 | 81.1% |
| 2013-02-01 | 81.1% |
| 2013-03-01 | 81.0% |
| 2013-04-01 | 81.0% |
| 2013-05-01 | 81.2% |
| 2013-06-01 | 81.2% |
| 2013-07-01 | 81.2% |
| 2013-08-01 | 81.0% |
| 2013-09-01 | 80.9% |
| 2013-10-01 | 80.6% |
| 2013-11-01 | 81.0% |
| 2013-12-01 | 80.8% |
| 2014-01-01 | 81.0% |
| 2014-02-01 | 81.2% |
| 2014-03-01 | 81.2% |
| 2014-04-01 | 80.8% |
| 2014-05-01 | 80.8% |
| 2014-06-01 | 80.9% |
| 2014-07-01 | 80.8% |
| 2014-08-01 | 81.1% |
| 2014-09-01 | 80.7% |
| 2014-10-01 | 80.8% |
| 2014-11-01 | 80.8% |
| 2014-12-01 | 80.8% |
| 2015-01-01 | 81.1% |
| 2015-02-01 | 81.0% |
| 2015-03-01 | 80.9% |
| 2015-04-01 | 81.0% |
| 2015-05-01 | 81.0% |
| 2015-06-01 | 80.8% |
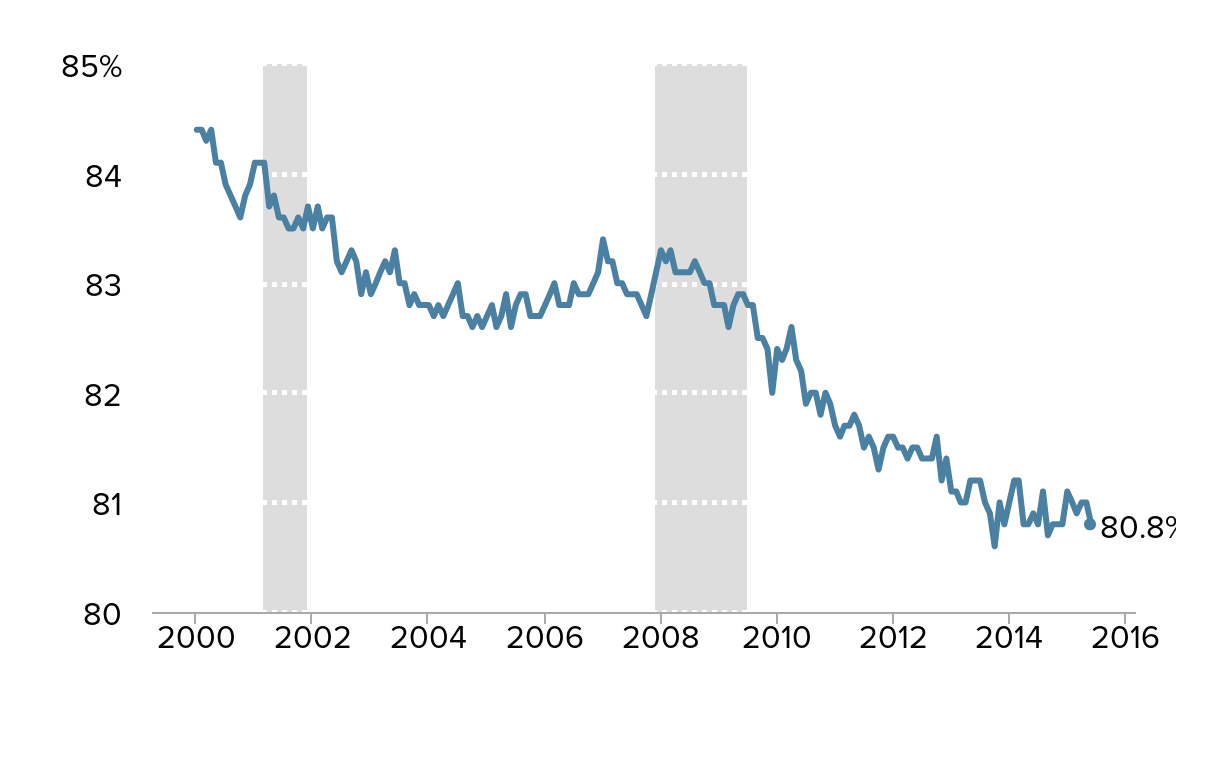
Note: Shaded areas denote recessions.
Source: EPI analysis of Bureau of Labor Statistics Current Population Survey public data series
In normal economic times a decline in the unemployment rate would be an unabashedly positive indication of a strengthening labor market. Unfortunately, throughout the recovery from the Great Recession labor force participation rates–even among prime-age workers–have frequently fallen significantly, dragging down measured unemployment for the wrong reason (see our estimate of these “missing workers” here). And this was again the case in June.
Furthermore, even at 5.3 percent, the unemployment rate remains unhealthily high. Andrew Figura and David Ratner have a nice piece detailing how the economy can likely see significantly lower unemployment before wage growth returns to historic norms, in part because of declines in workers’ bargaining power over the past decade (or more). It will be nice when a tightening labor market finally translates into decent wage growth, but we’re not there yet (more on that later).
Enjoyed this post?
Sign up for EPI's newsletter so you never miss our research and insights on ways to make the economy work better for everyone.