Nominal Wages Continue to Indicate How Far the Economy is from Full Recovery
One month of adding upwards of 300,000 jobs is not enough to say the economy is strong. In fact, adding jobs at November’s rate of growth wouldn’t lead us back to pre-recession labor market health until October 2016. And, then, there’s the story of nominal wage growth. Last month, nominal—i.e., not adjusted for inflation—wages grew only 2.1 percent, about on pace with what we’ve seen the last five years. This sluggish wage growth is a key sign that there’s still too much slack remaining in the labor market.
Let me put 2.1 percent nominal wage growth into perspective. The Federal Reserve’s mandate is to balance the benefits of low unemployment versus the benefits of keeping inflation stable. One sign of growing inflationary pressure is when nominal (not real) wages are rising significantly faster than the Fed’s target rate of inflation (currently 2 percent, which is not set in stone but which is widely acknowledged to be what the Fed is aiming for) plus productivity growth (between 1.5 to 2 percent). Putting those together, we get a target between 3.5 and 4 percent. Now consider our recent nominal wage growth of 2.1 percent. The fact is that nominal wages have been growing far slower than any reasonable wage target for the last five years.
To provide some context and help explain the role nominal wage growth plays in policymaking, we created a new EPI feature, the Nominal Wage Tracker. This page hosts the most up-to-date information on nominal wages, tracks how the cumulative effect of wages continues to lag behind target levels, and relates both of these to labor’s share of corporate-sector income. One of the statistics our tracker measures is the size of the accumulated gap between target and actual nominal wage growth, which now stands at $3.16 an hour.
Mind the wage gap: Cumulative nominal average hourly earnings, actual and hypothetical if they had grown at 4% since the recession began, 2007–2014
| Actual average hourly earnings of all private employees | Hypothetical, assuming 4% growth* | |
|---|---|---|
| Jan-2007 | $20.6 | |
| Feb-2007 | 20.68 | |
| Mar-2007 | 20.77 | |
| Apr-2007 | 20.83 | |
| May-2007 | 20.88 | |
| Jun-2007 | 21 | |
| Jul-2007 | 21 | |
| Aug-2007 | 21.04 | |
| Sep-2007 | 21.07 | |
| Oct-2007 | 21.11 | |
| Nov-2007 | 21.16 | |
| Dec-2007 | 21.21 | $21.21 |
| Jan-2008 | 21.24 | 21.27943602 |
| Feb-2008 | 21.31 | 21.34909936 |
| Mar-2008 | 21.4 | 21.41899075 |
| Apr-2008 | 21.42 | 21.48911096 |
| May-2008 | 21.51 | 21.55946071 |
| Jun-2008 | 21.56 | 21.63004078 |
| Jul-2008 | 21.63 | 21.7008519 |
| Aug-2008 | 21.73 | 21.77189484 |
| Sep-2008 | 21.76 | 21.84317036 |
| Oct-2008 | 21.81 | 21.91467922 |
| Nov-2008 | 21.92 | 21.98642218 |
| Dec-2008 | 21.98 | 22.0584 |
| Jan-2009 | 21.99 | 22.13061346 |
| Feb-2009 | 22.05 | 22.20306333 |
| Mar-2009 | 22.08 | 22.27575038 |
| Apr-2009 | 22.11 | 22.34867539 |
| May-2009 | 22.12 | 22.42183914 |
| Jun-2009 | 22.15 | 22.49524241 |
| Jul-2009 | 22.19 | 22.56888598 |
| Aug-2009 | 22.26 | 22.64277064 |
| Sep-2009 | 22.26 | 22.71689718 |
| Oct-2009 | 22.32 | 22.79126639 |
| Nov-2009 | 22.37 | 22.86587906 |
| Dec-2009 | 22.38 | 22.940736 |
| Jan-2010 | 22.42 | 23.015838 |
| Feb-2010 | 22.45 | 23.09118586 |
| Mar-2010 | 22.47 | 23.1667804 |
| Apr-2010 | 22.5 | 23.24262241 |
| May-2010 | 22.54 | 23.31871271 |
| Jun-2010 | 22.54 | 23.3950521 |
| Jul-2010 | 22.6 | 23.47164142 |
| Aug-2010 | 22.64 | 23.54848146 |
| Sep-2010 | 22.68 | 23.62557306 |
| Oct-2010 | 22.74 | 23.70291704 |
| Nov-2010 | 22.74 | 23.78051422 |
| Dec-2010 | 22.77 | 23.85836544 |
| Jan-2011 | 22.86 | 23.93647152 |
| Feb-2011 | 22.86 | 24.0148333 |
| Mar-2011 | 22.88 | 24.09345161 |
| Apr-2011 | 22.93 | 24.17232731 |
| May-2011 | 23 | 24.25146121 |
| Jun-2011 | 23.02 | 24.33085419 |
| Jul-2011 | 23.11 | 24.41050707 |
| Aug-2011 | 23.08 | 24.49042072 |
| Sep-2011 | 23.12 | 24.57059599 |
| Oct-2011 | 23.22 | 24.65103372 |
| Nov-2011 | 23.2 | 24.73173479 |
| Dec-2011 | 23.22 | 24.81270006 |
| Jan-2012 | 23.25 | 24.89393038 |
| Feb-2012 | 23.3 | 24.97542663 |
| Mar-2012 | 23.37 | 25.05718968 |
| Apr-2012 | 23.4 | 25.1392204 |
| May-2012 | 23.41 | 25.22151966 |
| Jun-2012 | 23.47 | 25.30408836 |
| Jul-2012 | 23.52 | 25.38692736 |
| Aug-2012 | 23.51 | 25.47003755 |
| Sep-2012 | 23.58 | 25.55341983 |
| Oct-2012 | 23.56 | 25.63707507 |
| Nov-2012 | 23.64 | 25.72100419 |
| Dec-2012 | 23.71 | 25.80520806 |
| Jan-2013 | 23.75 | 25.8896876 |
| Feb-2013 | 23.79 | 25.9744437 |
| Mar-2013 | 23.81 | 26.05947727 |
| Apr-2013 | 23.86 | 26.14478921 |
| May-2013 | 23.89 | 26.23038045 |
| Jun-2013 | 23.98 | 26.31625189 |
| Jul-2013 | 23.97 | 26.40240445 |
| Aug-2013 | 24.03 | 26.48883905 |
| Sep-2013 | 24.06 | 26.57555662 |
| Oct-2013 | 24.09 | 26.66255808 |
| Nov-2013 | 24.15 | 26.74984435 |
| Dec-2013 | 24.17 | 26.83741638 |
| Jan-2014 | 24.22 | 26.9252751 |
| Feb-2014 | 24.29 | 27.01342144 |
| Mar-2014 | 24.32 | 27.10185636 |
| Apr-2014 | 24.33 | 27.19058078 |
| May-2014 | 24.38 | 27.27959567 |
| Jun-2014 | 24.45 | 27.36890197 |
| Jul-2014 | 24.46 | 27.45850063 |
| Aug-2014 | 24.54 | 27.54839261 |
| Sep-2014 | 24.53 | 27.63857888 |
| Oct-2014 | 24.57 | 27.7290604 |
| Nov-2014 | 24.66 | 27.8198381 |
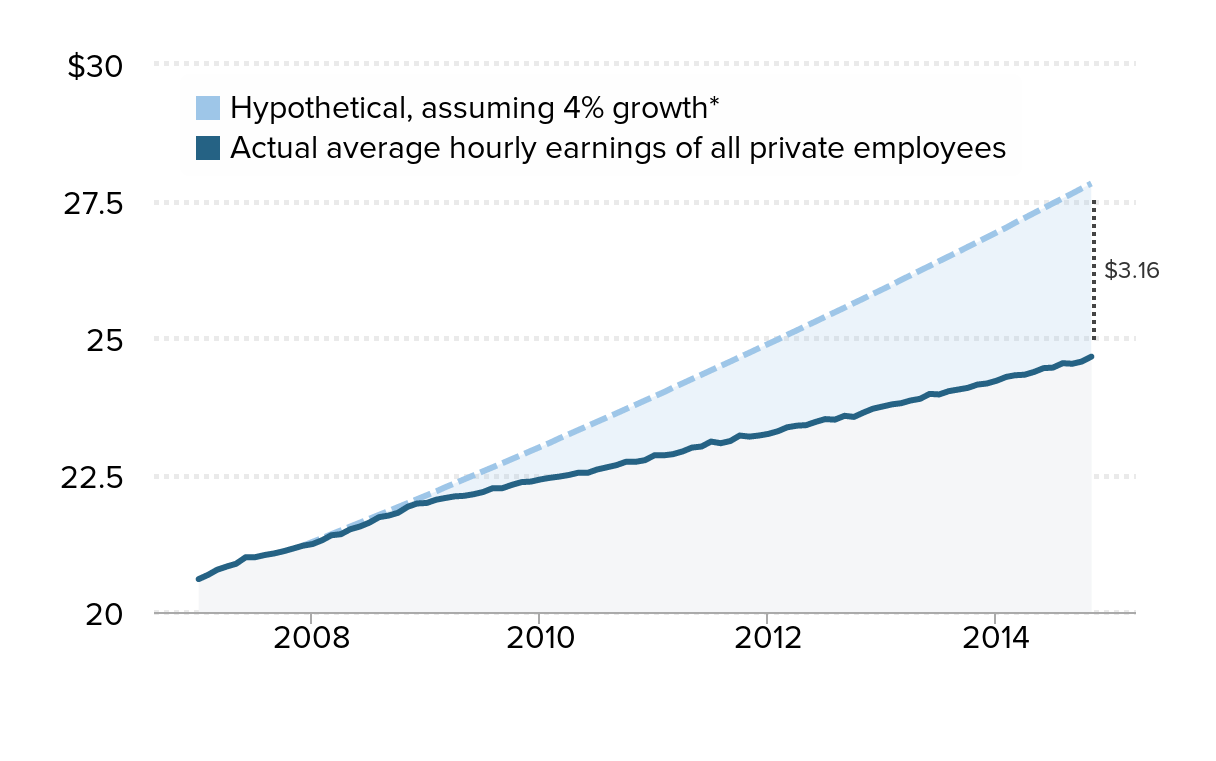
* Nominal wage growth consistent with the Federal Reserve Board's 2 percent inflation target, 2 percent productivity growth, and a stable labor share of income.
Source: EPI analysis of Bureau of Labor Statistics Current Employment Statistics public data series
Just like one month of decent job growth isn’t enough to say the economy is back, one month of strong wage growth—which I hope to see sooner rather than later—is not enough. Once wage growth gets into our target region, it needs to stay there for an extended time to regain some of the lost wages. Furthermore, it has to exceed that target to claw back the labor share—the share of corporate-sector income that goes to wages and benefits as opposed to profits—that has failed to begin any reliable rise following its fall from the aftermath of the Great Recession.
Enjoyed this post?
Sign up for EPI's newsletter so you never miss our research and insights on ways to make the economy work better for everyone.