Economy Adds Jobs but We Need to Raise America’s Pay
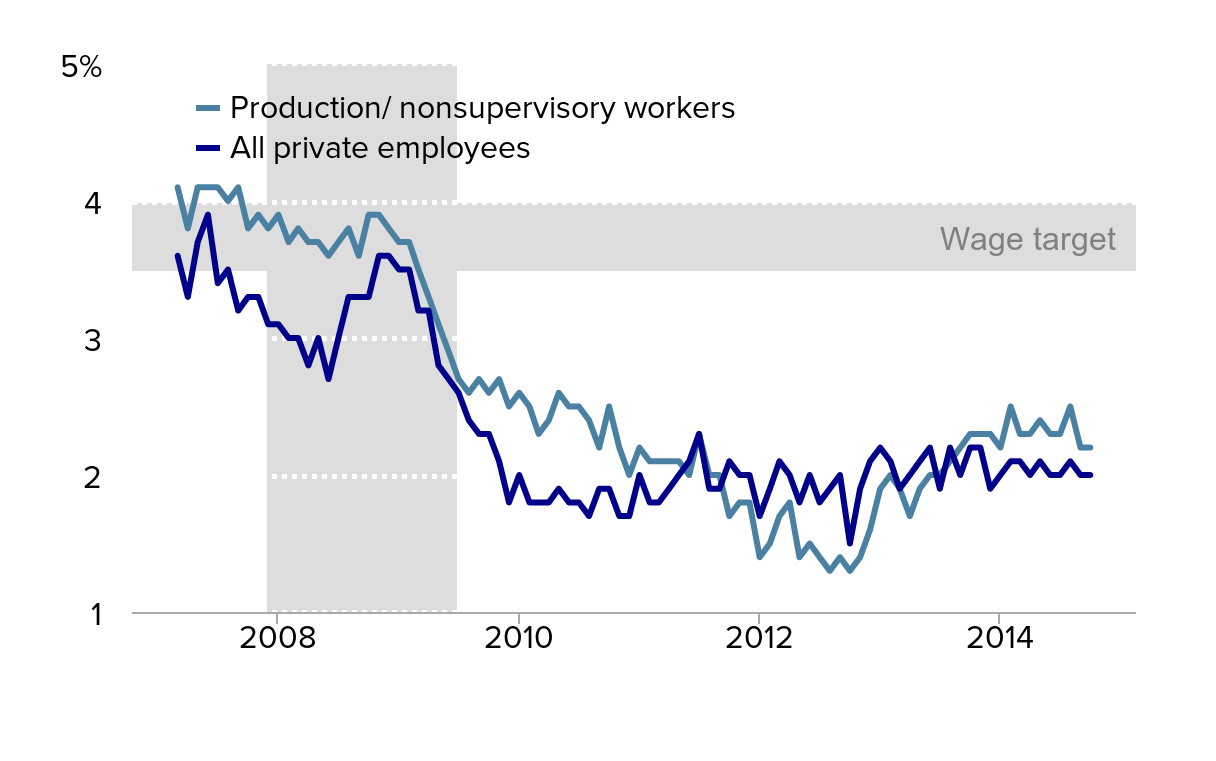
In the BLS report this morning, overall jobs numbers were solid and the unemployment rate continued to show signs of improvement. However, the unfortunate downside of this morning’s release is that wage growth has continued to be sluggish. Average hourly earnings of all employees on nonfarm payrolls and average hourly earnings of production and nonsupervisory employees on private nonfarm payrolls saw 2.0 percent and 2.2 percent growth, respectively, over this last year.
Despite fears from some inflation hawks, the fact is that the weak labor market of the last seven years has put enormous downward pressure on wages, and there has been no significant pickup in nominal wage growth in recent years. Wage growth is far below the 3.5 percent rate consistent with the Federal Reserve Board’s inflation target of 2 percent, and far below the 4 percent rate that could easily be absorbed for a while to restore labor’s share of national income from its current historic lows.
This lackluster wage growth is a clear indicator that there’s still considerable slack in the labor market. With so many Americans looking for work—and millions more who would be looking for work if job opportunities were stronger—employers simply don’t have to offer wage increases to get and keep the workers they need. It’s a positive sign that the economy is growing, but it’s simply not enough for workers to feel the effects in their paychecks.
Year-over-year change in nominal average hourly earnings of all private nonfarm employees and private production/nonsupervisory workers, 2007–2014
| Month | All private employees | Production/nonsupervisory workers |
|---|---|---|
| Mar-2007 | 3.6% | 4.1% |
| Apr-2007 | 3.3% | 3.8% |
| May-2007 | 3.7% | 4.1% |
| Jun-2007 | 3.9% | 4.1% |
| Jul-2007 | 3.4% | 4.1% |
| Aug-2007 | 3.5% | 4.0% |
| Sep-2007 | 3.2% | 4.1% |
| Oct-2007 | 3.3% | 3.8% |
| Nov-2007 | 3.3% | 3.9% |
| Dec-2007 | 3.1% | 3.8% |
| Jan-2008 | 3.1% | 3.9% |
| Feb-2008 | 3.0% | 3.7% |
| Mar-2008 | 3.0% | 3.8% |
| Apr-2008 | 2.8% | 3.7% |
| May-2008 | 3.0% | 3.7% |
| Jun-2008 | 2.7% | 3.6% |
| Jul-2008 | 3.0% | 3.7% |
| Aug-2008 | 3.3% | 3.8% |
| Sep-2008 | 3.3% | 3.6% |
| Oct-2008 | 3.3% | 3.9% |
| Nov-2008 | 3.6% | 3.9% |
| Dec-2008 | 3.6% | 3.8% |
| Jan-2009 | 3.5% | 3.7% |
| Feb-2009 | 3.5% | 3.7% |
| Mar-2009 | 3.2% | 3.5% |
| Apr-2009 | 3.2% | 3.3% |
| May-2009 | 2.8% | 3.1% |
| Jun-2009 | 2.7% | 2.9% |
| Jul-2009 | 2.6% | 2.7% |
| Aug-2009 | 2.4% | 2.6% |
| Sep-2009 | 2.3% | 2.7% |
| Oct-2009 | 2.3% | 2.6% |
| Nov-2009 | 2.1% | 2.7% |
| Dec-2009 | 1.8% | 2.5% |
| Jan-2010 | 2.0% | 2.6% |
| Feb-2010 | 1.8% | 2.5% |
| Mar-2010 | 1.8% | 2.3% |
| Apr-2010 | 1.8% | 2.4% |
| May-2010 | 1.9% | 2.6% |
| Jun-2010 | 1.8% | 2.5% |
| Jul-2010 | 1.8% | 2.5% |
| Aug-2010 | 1.7% | 2.4% |
| Sep-2010 | 1.9% | 2.2% |
| Oct-2010 | 1.9% | 2.5% |
| Nov-2010 | 1.7% | 2.2% |
| Dec-2010 | 1.7% | 2.0% |
| Jan-2011 | 2.0% | 2.2% |
| Feb-2011 | 1.8% | 2.1% |
| Mar-2011 | 1.8% | 2.1% |
| Apr-2011 | 1.9% | 2.1% |
| May-2011 | 2.0% | 2.1% |
| Jun-2011 | 2.1% | 2.0% |
| Jul-2011 | 2.3% | 2.3% |
| Aug-2011 | 1.9% | 2.0% |
| Sep-2011 | 1.9% | 2.0% |
| Oct-2011 | 2.1% | 1.7% |
| Nov-2011 | 2.0% | 1.8% |
| Dec-2011 | 2.0% | 1.8% |
| Jan-2012 | 1.7% | 1.4% |
| Feb-2012 | 1.9% | 1.5% |
| Mar-2012 | 2.1% | 1.7% |
| Apr-2012 | 2.0% | 1.8% |
| May-2012 | 1.8% | 1.4% |
| Jun-2012 | 2.0% | 1.5% |
| Jul-2012 | 1.8% | 1.4% |
| Aug-2012 | 1.9% | 1.3% |
| Sep-2012 | 2.0% | 1.4% |
| Oct-2012 | 1.5% | 1.3% |
| Nov-2012 | 1.9% | 1.4% |
| Dec-2012 | 2.1% | 1.6% |
| Jan-2013 | 2.2% | 1.9% |
| Feb-2013 | 2.1% | 2.0% |
| Mar-2013 | 1.9% | 1.9% |
| Apr-2013 | 2.0% | 1.7% |
| May-2013 | 2.1% | 1.9% |
| Jun-2013 | 2.2% | 2.0% |
| Jul-2013 | 1.9% | 2.0% |
| Aug-2013 | 2.2% | 2.1% |
| Sep-2013 | 2.0% | 2.2% |
| Oct-2013 | 2.2% | 2.3% |
| Nov-2013 | 2.2% | 2.3% |
| Dec-2013 | 1.9% | 2.3% |
| Jan-2014 | 2.0% | 2.2% |
| Feb-2014 | 2.1% | 2.5% |
| Mar-2014 | 2.1% | 2.3% |
| Apr-2014 | 2.0% | 2.3% |
| May-2014 | 2.1% | 2.4% |
| Jun-2014 | 2.0% | 2.3% |
| Jul-2014 | 2.0% | 2.3% |
| Aug-2014 | 2.1% | 2.5% |
| Sep-2014 | 2.0% | 2.2% |
| Oct-2014 | 2.0% | 2.2% |

Note: Wage target consistent with Federal Reserve Board's 2 percent inflation target and 1.5% labor productivity growth assumption. Light shaded area denotes recession.
Source: Authors' analysis of Bureau of Labor Statistics' Current Employment Statistics, public data series.
Enjoyed this post?
Sign up for EPI's newsletter so you never miss our research and insights on ways to make the economy work better for everyone.
