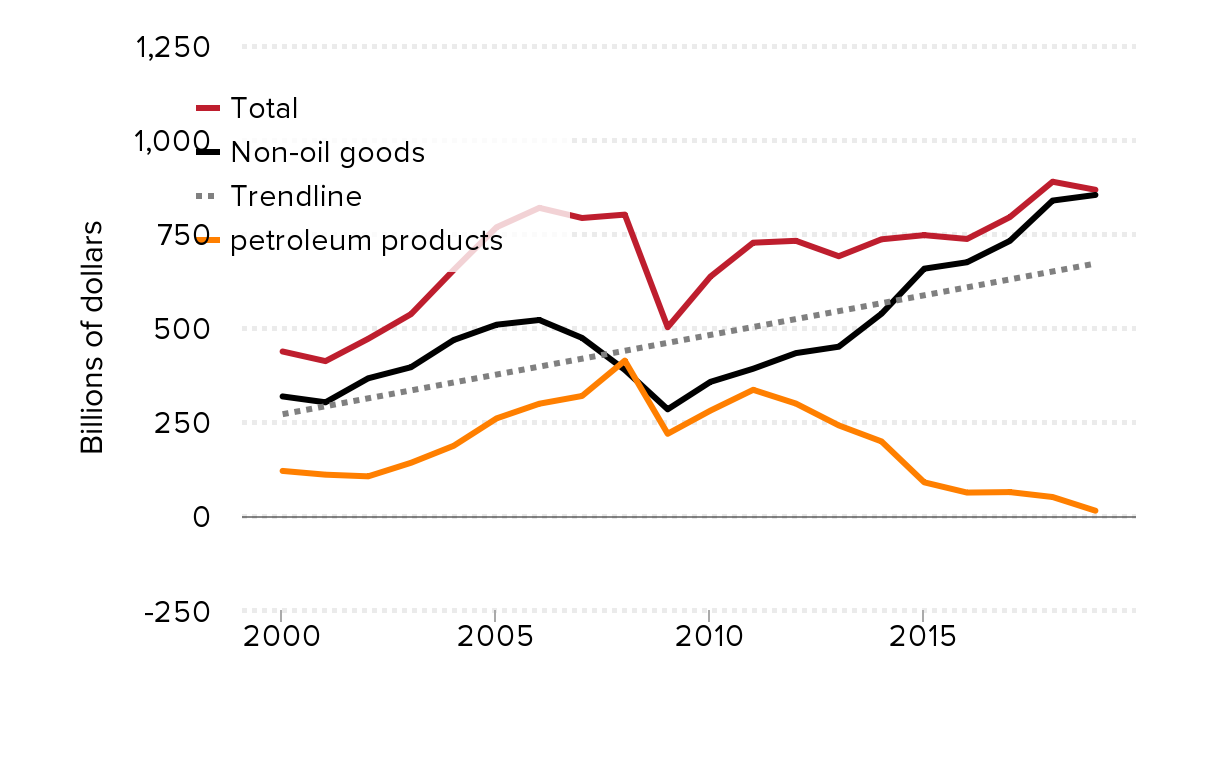
Declining trade balances disguise continued growth in the non-oil trade deficit
The overall goods and services trade deficit declined 1.7% ($10.9 billion) in 2019, while the total deficit in goods trade fell 2.4% ($21.4 billion). However, the U.S. trade deficit in non-oil goods, which is dominated by trade in manufactured products, increased 1.8% in 2019. Aside from petroleum, trade was a net drag on the economy in 2019 and on manufacturing, in particular.
The small decline in overall U.S. trade deficits follows an 18.3% increase in the goods trade deficit in the first two years of the Trump administration. Taken altogether, the U.S. goods trade deficit increased $116.2 billion (15.5%) in the first three years of the Trump Administration. It has proven neither quick nor easy to reduce the growing U.S. goods trade deficit.
The petroleum products deficit decreased 72.6% in 2019, masking the 1.8% increase in the non-oil goods trade deficit within the overall 2.4% decline in the U.S. goods trade balance. The fracking revolution has resulted in a significant reduction in oil imports (13.9%) and a small increase in petroleum exports (2.8%).
Recent changes in petroleum trade yield this shocking factoid: The United States became a net exporter of petroleum products for the last four months of 2019. This reflects a key element of Trump’s trade “strategy” to export liquefied natural gas (LNG) to the rest of the world, which comes at a steep cost. This will drive up U.S. prices for natural gas and oil, despite the fact that low energy prices were a key element of the mini-recovery in US manufacturing exports. Increased LNG exports will hurt U.S. consumers by increasing fuel costs, heightening risks of transport and catastrophic port explosions, and exacerbating global warming and air pollution levels in the country as a whole.
Trends in the major components of U.S. goods trade are shown in the Figure A, below. Trade in petroleum products used to account for a significant share of the overall U.S. goods trade deficit, peaking at more than $400 billion in 2008. But the deficit in petroleum products virtually disappeared in 2019. The overall goods trade deficit grew rapidly just before the Great Recession, declined sharply in the downturn, and has increased modestly during the recovery.
The U.S. goods trade deficit has been steadily increasing since 2000
| Years | Total | petroleum products | Non-oil goods | Trendline |
|---|---|---|---|---|
| 2000 | 436.469 | 119.317 | 317.152 | 270 |
| 2001 | 410.933 | 109.37 | 301.563 | |
| 2002 | 470.291 | 104.954 | 365.337 | |
| 2003 | 535.652 | 140.916 | 394.736 | |
| 2004 | 653.126 | 186.126 | 467 | |
| 2005 | 766.561 | 258.879 | 507.682 | |
| 2006 | 817.976 | 297.812 | 520.164 | |
| 2007 | 790.991 | 318.414 | 472.577 | |
| 2008 | 800.006 | 412.24 | 387.765 | |
| 2009 | 500.944 | 217.972 | 282.972 | |
| 2010 | 635.362 | 279.531 | 355.831 | |
| 2011 | 725.447 | 334.722 | 390.724 | |
| 2012 | 730.446 | 298.238 | 432.209 | |
| 2013 | 689.47 | 240.251 | 449.219 | |
| 2014 | 734.482 | 197.67 | 536.812 | |
| 2015 | 745.483 | 89.019 | 656.464 | |
| 2016 | 735.326 | 61.8325 | 673.494 | |
| 2017 | 793.411 | 63.1284 | 730.282 | |
| 2018 | 887.337 | 50.041 | 837.296 | |
| 2019 | 865.985 | 13.713 | 852.272 | 670 |

Source: EPI analysis of U.S. International Trade commission, Trade DataWeb, and U.S. Census Bureau, Foreign Trade release.
Meanwhile, the deficit in non-oil goods trade has nearly tripled since 2000, rising from $317.2 billion in 2000 to $852.3 billion in 2019, an all-time high. For the past two years, the non-oil goods trade deficit also reached record territory as a share of GDP, reaching or exceeding 4.0% of GDP. This growing U.S. trade deficit in non-oil goods is largely responsible for the loss of 5 million U.S. manufacturing jobs since 1998.
The trade deficit with China declined significantly in 2019. However, China is exporting goods to the United States through other countries. As the overall U.S. trade deficit in non-oil goods has increased, so has China’s overall balance of trade with the world, suggesting that trade diversion—Chinese goods, parts, and materials being used in products that the United States imports from other countries—has grown in importance.
The U.S. goods trade deficit with the rest of the world increased significantly in 2019, rising from $455.3 billion in 2018 to $507.3 billion in 2019, an increase of 11.4%. The deficit grew rapidly with many countries, including Mexico ($21.1 billion, 26%), Canada ($8.0 billion, 42%), Korea ($2.9 billion, 16%), Taiwan ($7.8 billion, 52%), and South/Central America ($11.7 billion, 28%). There are many ports that may be used to redirect China’s exports to the United States.
The most important cause of large and growing U.S. trade deficits is persistent currency undervaluation by countries such as China, Japan, and Korea, which have run large, persistent trade surpluses, as well as large structural surpluses accumulated by the European Union, especially Germany and the Netherlands. The real, trade-weighted value of the U.S. dollar increased 19.7% between December 2013 and December 2019. Absent aggressive efforts to reduce its value, the strong dollar will put continuing upward pressure on the trade deficit, and downward pressure on employment and output in U.S. manufacturing.
Enjoyed this post?
Sign up for EPI's newsletter so you never miss our research and insights on ways to make the economy work better for everyone.
