July 27, 2007
Net export growth pulls up GDP in second quarter
by EPI economist L. Josh Bivens
The Bureau of Economic Analysis (BEA) reported today that real (inflation-adjusted) gross domestic product (GDP) grew 3.4% in the second quarter of 2007, up from 0.6% growth in the first quarter. Over the past four quarters, GDP growth has averaged only 1.8%.
The strongest contributions to this growth came from net exports, which added 1.2 percentage points to the quarter’s growth. Export growth and import decline both contributed to this boost from the trade balance. While this net export growth could be the result of a weaker U.S. dollar, the dollar has been weak for some time without providing consistent boosts from net exports. Only a longer stretch of consistently positive net export growth will determine if it is to become a dependable (and welcome) aspect of U.S. growth over the next couple of years.
Personal consumption expenditures added only 0.9 percentage points in the second quarter, driven entirely by consumption of services. Small declines in durable goods and small increases in non-durable goods essentially offset each other. Government spending added another 0.9 percentage points to the quarter’s growth.
Residential investment continued to drag on GDP growth, knocking 0.5 percentage points off of the second quarter’s growth rate. Despite a negative contribution from residential investment for the past year and a half, nonresidential investment, in contrast to most previous business cycles, continues to contribute positively to GDP growth.
Growth in final sales tracked the overall GDP number, growing 3.2%. However, domestic demand growth was up only 1.9%, barely up from the 1.7% growth over the first quarter. This measure has averaged only 1.7% growth over the past year. Given the continuing weakness in domestic demand, this quarter’s positive contribution from net exports was most welcome, and these will need to play a large role over the next year to keep the U.S. economy growing at an acceptable rate over the next couple of years.
Real personal disposable income (income left after tax payments) declined slightly (-.8%) in the second quarter. This was attributable mostly to the relatively high rate of inflation in personal consumption expenditures (4.3%). Both employee compensation (up 3.0%) and wage payments (up 2.8%) lagged this inflation measure. This fall in the real purchasing power of households does not bode well for domestic demand growth going forward.
Despite high inflation in the overall personal consumption deflator for the past two quarters (4.3% this quarter and 3.5% last quarter), core measures of inflation that exclude food and energy costs remained relatively tame. The “market-based” personal consumption deflator excluding food and energy was up only 1.9% in this quarter, essentially unchanged from last quarter’s 1.8% figure. This inflation measure is well within the comfort zone that has been identified by observers of the Federal Reserve.
Today’s release also included revisions to the GDP and related series back to 2004. The most significant revision is to the headline GDP number, which was revised downward for all three years between 2004 and 2006. The cumulative impact of the revisions over the three years knocked 0.8 percentage points off measured GDP. The biggest component revisions were downward adjustments to personal consumption expenditures.
Besides the headline GDP number, perhaps the single most striking change in these revisions is to the savings rate. Savings had been reported as negative for the past seven quarters as of the last advance GDP report. Now, due to upward revisions in personal disposable income and to downward revisions to personal outlays, savings are reported as negative for only two quarters of the last two years.
For the second quarter, the savings rate was 0.6%, and, while the long run of negative reported rates has been undone by the revisions, the savings rate over this recovery remains historically low.
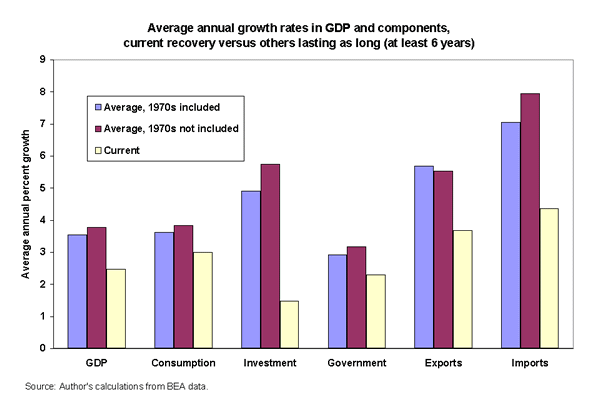
Given the revisions going back to 2004, it is worth examining how the current recovery compares to other recent recoveries. The Chart shows average annual growth in GDP and its components in the current recovery and previous recoveries that lasted six years. The overall picture is a recovery that is relatively weak in GDP terms, and only near historic norms in growth in consumption and government spending.
This quarter’s GDP data, while better than the anemic growth in the first quarter (the slowest growth since the last quarter of 2002), provide little reason to be complacent about the economy going forward, especially given the continuing drag that a cooling housing market will place on the economy. Again, net exports will be a key variable to watch, as domestic demand seems unlikely to provide enough stimulus to keep the economy moving forward at normal growth rates.
To view archived editions of GDP PICTURE, click here.
The Economic Policy Institute GDP PICTURE is published quarterly upon release of the Bureau of Economic Analysis’ quarterly GDP report.
EPI offers same-day analysis of income, price, employment, and other economic data released by U.S. government agencies. For more information, contact EPI at 202-775-8810.