Full Report
This summer, workers across the country—from Hollywood writers to nurses, factory workers, and Starbucks baristas—were either walking a picket line or preparing for labor actions, the latest sign that U.S. workers are increasingly interested in using collective action to improve the terms and conditions of work. In fact, workers are filing petitions for union elections and charges for violations of their right to organize and bargain collectively at the highest rates since the 1950s. The number of workers involved in major work stoppages hit its highest levels in decades in the years before the COVID-19 pandemic, particularly in 2018 and 2019. After subsiding in 2020 and 2021, the number of workers involved in major work stoppages grew by 50% in 2022.
What is driving this resurgence of movements to reclaim the leverage that collective bargaining once gave much larger swathes of the workforce, and why is it happening now? Precise answers are worker- and action-specific, but it’s worth noting the context—the U.S. economy has been churning out radically unequal income growth for decades. Further, essentially all of this increased inequality has come from unbalanced bargaining power in the labor market. Given this backdrop, some response from workers looking to exercise more labor market power makes sense. In this report we will examine the economic conditions spurring the rise in labor actions—specifically strikes. Then we will discuss the limitations that have been placed on workers’ ability to strike and conclude with policy changes that could strengthen workers’ fundamental and effective right to withhold their labor to improve their working conditions.
Economic background
Perpetually rising inequality is not an inevitable feature of capitalism. The high and rising inequality that began in the late 1970s followed a decades-long stretch of stable and historically low inequality—a period dubbed “the Great Compression” (roughly the mid 1930s to the late 1970s). But the Great Compression did not happen spontaneously. It was the direct result of policies and institutions that boosted the leverage and bargaining power of typical workers in the labor market. As a concerted policy assault has steadily eroded these policies and institutions, inequality began rising. In short, a nation’s distribution of income is a political choice, the deliberate result of the policies the nation enacts (Bivens and Mishel 2021).
The most important ingredient in the policy regime that led to and sustained the Great Compression was public policy support for workers organizing unions and bargaining collectively. There has never been a sustained period of broadly shared growth in any advanced economy without strong unions. While high and rising inequality is not an inevitable feature of capitalism, it does seem to be inevitable when unions are under assault.
This backdrop of high and rising inequality and the role that policy-driven attacks on collective bargaining have played in generating inequality should be kept in mind as this summer’s labor actions unfold. The following exhibits offer some precise context.
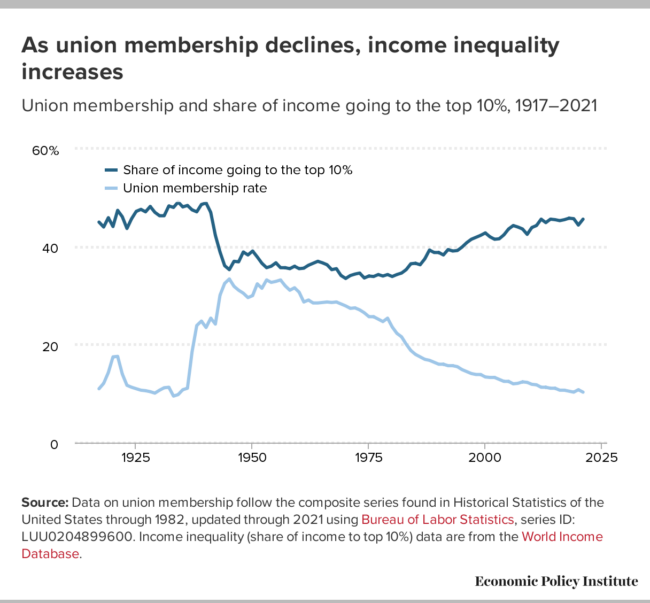
Figure A below shows the long-run trajectory of unionization in the U.S. economy and one key metric of inequality—the share of total income claimed by the top 10% of households. The beginning of the Great Compression clearly coincides with the burst of unionization following the passage of the Wagner Act in 1935 and the labor peace enforced by federal legislation in the run-up to World War II. The Wagner Act and the labor peace provisions included as part of the enormous defense build-up in the late 1930s and 1940s clearly put the federal government on the side of workers seeking to form unions, creating an affirmative legal right to organize and join unions, obligating employers to bargain collectively with unions, and conditioning receipt of defense contracts on respect for workers’ decisions to unionize.
As union membership declines, income inequality increases: Union membership and share of income going to the top 10%, 1917–2021
| Union membership rate | Share of income going to the top 10% | |
|---|---|---|
| 1917 | 11.00% | 45.0% |
| 1918 | 12.10% | 44.0% |
| 1919 | 14.30% | 45.9% |
| 1920 | 17.50% | 44.1% |
| 1921 | 17.60% | 47.4% |
| 1922 | 14.00% | 46.1% |
| 1923 | 11.70% | 43.7% |
| 1924 | 11.30% | 45.7% |
| 1925 | 11.00% | 47.2% |
| 1926 | 10.70% | 47.6% |
| 1927 | 10.60% | 47.1% |
| 1928 | 10.40% | 48.2% |
| 1929 | 10.10% | 47.0% |
| 1930 | 10.70% | 46.3% |
| 1931 | 11.20% | 46.3% |
| 1932 | 11.30% | 48.3% |
| 1933 | 9.50% | 48.0% |
| 1934 | 9.80% | 49.1% |
| 1935 | 10.80% | 48.1% |
| 1936 | 11.10% | 48.4% |
| 1937 | 18.60% | 47.5% |
| 1938 | 23.90% | 47.1% |
| 1939 | 24.80% | 48.6% |
| 1940 | 23.50% | 48.9% |
| 1941 | 25.40% | 47.0% |
| 1942 | 24.20% | 42.3% |
| 1943 | 30.10% | 38.9% |
| 1944 | 32.50% | 36.1% |
| 1945 | 33.40% | 35.3% |
| 1946 | 31.90% | 37.0% |
| 1947 | 31.10% | 36.9% |
| 1948 | 30.50% | 38.9% |
| 1949 | 29.60% | 38.3% |
| 1950 | 30.00% | 39.1% |
| 1951 | 32.40% | 37.9% |
| 1952 | 31.50% | 36.6% |
| 1953 | 33.20% | 35.7% |
| 1954 | 32.70% | 36.0% |
| 1955 | 32.90% | 36.7% |
| 1956 | 33.20% | 35.7% |
| 1957 | 32.00% | 35.7% |
| 1958 | 31.10% | 35.5% |
| 1959 | 31.60% | 36.0% |
| 1960 | 30.70% | 35.5% |
| 1961 | 28.70% | 35.6% |
| 1962 | 29.10% | 36.2% |
| 1963 | 28.50% | 36.6% |
| 1964 | 28.50% | 37.0% |
| 1965 | 28.60% | 36.7% |
| 1966 | 28.70% | 36.3% |
| 1967 | 28.60% | 35.3% |
| 1968 | 28.70% | 35.5% |
| 1969 | 28.30% | 34.1% |
| 1970 | 27.90% | 33.5% |
| 1971 | 27.40% | 34.1% |
| 1972 | 27.50% | 34.4% |
| 1973 | 27.10% | 34.6% |
| 1974 | 26.50% | 33.6% |
| 1975 | 25.70% | 34.0% |
| 1976 | 25.70% | 33.9% |
| 1977 | 25.20% | 34.3% |
| 1978 | 24.70% | 34.0% |
| 1979 | 25.40% | 34.3% |
| 1980 | 23.60% | 33.9% |
| 1981 | 22.30% | 34.3% |
| 1982 | 21.60% | 34.6% |
| 1983 | 20.1% | 35.3% |
| 1984 | 18.8% | 36.5% |
| 1985 | 18.0% | 36.6% |
| 1986 | 17.5% | 36.3% |
| 1987 | 17.0% | 37.5% |
| 1988 | 16.8% | 39.3% |
| 1989 | 16.4% | 38.8% |
| 1990 | 16.0% | 38.8% |
| 1991 | 16.0% | 38.3% |
| 1992 | 15.7% | 39.4% |
| 1993 | 15.7% | 39.1% |
| 1994 | 15.5% | 39.2% |
| 1995 | 14.9% | 39.9% |
| 1996 | 14.5% | 40.8% |
| 1997 | 14.1% | 41.5% |
| 1998 | 13.9% | 41.9% |
| 1999 | 13.9% | 42.3% |
| 2000 | 13.4% | 42.8% |
| 2001 | 13.3% | 42.0% |
| 2002 | 13.3% | 41.5% |
| 2003 | 12.9% | 41.6% |
| 2004 | 12.5% | 42.4% |
| 2005 | 12.5% | 43.6% |
| 2006 | 12.0% | 44.3% |
| 2007 | 12.1% | 44.0% |
| 2008 | 12.4% | 43.6% |
| 2009 | 12.3% | 42.5% |
| 2010 | 11.9% | 43.9% |
| 2011 | 11.8% | 44.3% |
| 2012 | 11.3% | 45.6% |
| 2013 | 11.3% | 44.9% |
| 2014 | 11.1% | 45.6% |
| 2015 | 11.1% | 45.5% |
| 2016 | 10.7% | 45.3% |
| 2017 | 10.7% | 45.5% |
| 2018 | 10.5% | 45.8% |
| 2019 | 10.3% | 45.7% |
| 2020 | 10.8% | 44.4% |
| 2021 | 10.3% | 45.6% |

Source: Data on union membership follow the composite series found in Historical Statistics of the United States through 1982, updated through 2021 using Bureau of Labor Statistics, series ID: LUU0204899600. Income inequality (share of income to top 10%) data are from the World Income Database.
This initial policy push to aid unionization begins to unravel with the 1947 Taft-Hartley Act (which among many other things allowed states to put barriers in front of unionization efforts through so-called Right to Work laws and legalized new forms of employer anti-union activity). The unionization rate peaks in the 1950s, but then the late 1970s sees a clear inflection point for both unionization and the top 10% share of income. As unionization rates fall sharply, the share of income going to the top 10% of U.S. households begins a steady upward march.
Some might wonder if the relationship shown in Figure A is purely a coincidence. It’s not. Jaumotte and Buitron (2015) find a robust correlation between higher unionization rates and higher shares of income claimed by the bottom 90% of households across a range of advanced economies after 1980. They also look at large and sharp drops in unionization (over 3-year periods) and find significant and rapid responses to these changes in the form of increased shares of income claimed by the top 10%. Their international evidence indicates that the decline in unionization since 1980 could account for roughly a third of the entire rise in the share of income claimed by the top 10% over that period.
Probably the strongest causal evidence that unions cause changes in inequality in the United States comes from Farber et al. (2021). They exploit a previously unused data set on unionization going back to the 1930s to assess the causal effect of the rise and subsequent fall of unions on income inequality. Their findings show a clear causal relationship between unionization rates and income inequality: Rising unionization decreased inequality before the 1970s, and falling unionization contributed strongly to increased inequality thereafter.
Farber et al. (2021) also find that the equalizing effect of strong unions was even greater for Black workers and that de-unionization in recent decades has hence disproportionately harmed Black workers. At the same time that growing union strength was narrowing class-based gaps in the U.S. economy, Black workers were both more likely to be in unions and to receive a larger income premium from union membership. The gradual sapping of union strength engineered by post-1979 policy is, therefore, a large contributor to the stagnation and then outright reversal of progress in narrowing wage gaps between Black and white workers.
Figure B provides one key piece of evidence that further strengthens the causal link implied in Figure A by demonstrating that inequality came from rising inequality of market-based incomes. This figure shows that the rise in the share of income claimed by the top 10% of households was driven entirely by market incomes, not by changes in either taxes or transfers. To be clear, a more progressive federal system of taxes and transfers can be a key ingredient in helping alleviate inequality, but this fiscal system did not drive today’s inequality—outcomes from markets did (labor markets, specifically). The figure shows the share of market income claimed by the top 10% and then the share of income after taxes and transfers claimed by this group. The rise in the market income share (8 percentage points) is substantially larger than the rise in post-tax and transfer income (5.7 percentage points). In short, federal taxes and transfers blunt the effect of inequality at any point in time, but they did not respond anywhere near strongly enough to undo the rise in market-based income inequality.
Rise of top 10% shares driven by market Incomes: Share of national income claimed by top 10% of households, 1979-2019
| Market income | Income after transfers and taxes | |
|---|---|---|
| 1979 | 9.0% | 7.0% |
| 1980 | 9.8% | 7.8% |
| 1981 | 9.6% | 7.9% |
| 1982 | 10.2% | 8.6% |
| 1983 | 10.8% | 9.0% |
| 1984 | 11.0% | 9.3% |
| 1985 | 11.5% | 9.8% |
| 1986 | 15.4% | 13.3% |
| 1987 | 11.3% | 9.2% |
| 1988 | 13.4% | 11.2% |
| 1989 | 13.7% | 11.5% |
| 1990 | 13.1% | 10.9% |
| 1991 | 12.0% | 9.7% |
| 1992 | 13.2% | 10.5% |
| 1993 | 12.4% | 9.5% |
| 1994 | 12.3% | 9.2% |
| 1995 | 13.1% | 9.8% |
| 1996 | 15.2% | 11.4% |
| 1997 | 16.4% | 12.6% |
| 1998 | 17.4% | 13.7% |
| 1999 | 17.8% | 14.1% |
| 2000 | 18.6% | 14.8% |
| 2001 | 15.6% | 12.1% |
| 2002 | 14.2% | 10.8% |
| 2003 | 14.9% | 11.4% |
| 2004 | 18.1% | 14.1% |
| 2005 | 18.8% | 14.7% |
| 2006 | 19.3% | 15.3% |
| 2007 | 21.4% | 17.2% |
| 2008 | 17.3% | 13.4% |
| 2009 | 15.9% | 11.8% |
| 2010 | 17.6% | 13.1% |
| 2011 | 17.4% | 13.0% |
| 2012 | 20.3% | 15.4% |
| 2013 | 17.2% | 12.3% |
| 2014 | 18.3% | 13.2% |
| 2015 | 18.3% | 13.2% |
| 2016 | 17.6% | 12.6% |
| 2017 | 18.2% | 13.4% |
| 2018 | 19.0% | 14.1% |
| 2019 | 17.0% | 12.7% |
Source: Congressional Budget Office (2022).
Figure C provides more evidence that this increase in market-based income inequality was driven by labor markets. This figure shows the growth in economywide productivity (or the amount of income generated in an average hour of work in the economy) and the hourly pay of typical workers. During the period of relative union strength that characterized the Great Compression, these two measures largely rose in lockstep. The set of policies and institutions that led to and sustained the large drop in inequality from the 1930s to the 1970s worked by linking the hourly pay of typical workers and overall economic growth. After 1979, at the same time as the pace of union decline picks up, these measures begin diverging rapidly. Essentially, a steadily rising amount of the income being generated in an average hour of work after 1979 began showing up in places besides the paychecks or benefits of typical workers.
The gap between productivity and a typical worker’s compensation has increased dramatically since 1979: Productivity growth and hourly compensation growth, 1948–2021
| ’Year | Effective TEP, net | Nonsupervisory compensation |
|---|---|---|
| 1948 | 45.79 | 48.20 |
| 1949 | 46.94 | 51.16 |
| 1950 | 50.33 | 53.14 |
| 1951 | 51.01 | 53.73 |
| 1952 | 52.61 | 55.32 |
| 1953 | 54.70 | 58.10 |
| 1954 | 55.82 | 59.35 |
| 1955 | 59.11 | 61.84 |
| 1956 | 60.14 | 64.30 |
| 1957 | 61.83 | 65.78 |
| 1958 | 62.89 | 66.21 |
| 1959 | 65.62 | 68.31 |
| 1960 | 66.62 | 69.74 |
| 1961 | 68.80 | 70.92 |
| 1962 | 71.61 | 73.09 |
| 1963 | 74.04 | 74.32 |
| 1964 | 76.63 | 81.46 |
| 1965 | 79.24 | 83.49 |
| 1966 | 81.68 | 84.79 |
| 1967 | 82.54 | 85.85 |
| 1968 | 85.39 | 88.11 |
| 1969 | 86.09 | 89.91 |
| 1970 | 87.70 | 91.20 |
| 1971 | 91.59 | 93.74 |
| 1972 | 95.29 | 98.78 |
| 1973 | 96.86 | 98.63 |
| 1974 | 94.20 | 96.64 |
| 1975 | 96.83 | 96.55 |
| 1976 | 99.27 | 97.90 |
| 1977 | 100.13 | 99.72 |
| 1978 | 101.27 | 101.20 |
| 1979 | 100.00 | 100.00 |
| 1980 | 97.34 | 97.34 |
| 1981 | 99.08 | 97.02 |
| 1982 | 98.22 | 97.22 |
| 1983 | 101.22 | 97.67 |
| 1984 | 103.66 | 96.94 |
| 1985 | 105.31 | 96.50 |
| 1986 | 107.80 | 97.07 |
| 1987 | 107.16 | 95.75 |
| 1988 | 108.68 | 95.44 |
| 1989 | 109.43 | 95.43 |
| 1990 | 109.81 | 94.64 |
| 1991 | 110.51 | 94.48 |
| 1992 | 114.82 | 95.12 |
| 1993 | 115.31 | 95.28 |
| 1994 | 116.37 | 95.52 |
| 1995 | 116.47 | 94.95 |
| 1996 | 117.94 | 95.01 |
| 1997 | 119.78 | 96.04 |
| 1998 | 122.25 | 98.33 |
| 1999 | 124.88 | 99.66 |
| 2000 | 126.39 | 100.17 |
| 2001 | 127.91 | 101.61 |
| 2002 | 131.66 | 103.62 |
| 2003 | 136.02 | 104.67 |
| 2004 | 139.73 | 104.23 |
| 2005 | 141.84 | 103.81 |
| 2006 | 142.57 | 103.82 |
| 2007 | 143.60 | 104.67 |
| 2008 | 141.78 | 104.71 |
| 2009 | 146.96 | 108.75 |
| 2010 | 151.06 | 109.63 |
| 2011 | 149.60 | 108.31 |
| 2012 | 149.95 | 107.26 |
| 2013 | 151.60 | 108.30 |
| 2014 | 152.12 | 108.59 |
| 2015 | 154.42 | 110.31 |
| 2016 | 154.57 | 111.25 |
| 2017 | 155.59 | 111.39 |
| 2018 | 157.21 | 112.12 |
| 2019 | 159.20 | 113.69 |
| 2020 | 161.80 | 117.61 |
| 2021 | 164.57 | 117.34 |
Notes: Data are for compensation (wages and benefits) of production/nonsupervisory workers in the private sector and net productivity of the total economy. “Net productivity” is the growth of output of goods and services less depreciation per hour worked.
Source: EPI analysis of unpublished Total Economy Productivity data from Bureau of Labor Statistics (BLS) Labor Productivity and Costs program, wage data from the BLS Current Employment Statistics, BLS Employment Cost Trends, BLS Consumer Price Index, and Bureau of Economic Analysis National Income and Product Accounts.
Some of this income was shifted into corporate profits and other business income. Most of the income showed up at the very top of the wage scale as the pay of corporate executives and managers (along with some other highly privileged professionals) began skyrocketing. Between 1979 and 2022, the (inflation-adjusted) annual wages of the top 1% of workers rose by 145%, while the average annual wages of the bottom 90% rose by only 16%—or about a tenth as fast (Gould and Kandra 2022). Substantial research looking more narrowly at the influence of unions on both executive pay and profits shows that higher unionization is associated with more equal wage structures and a shift toward wages and away from corporate profits.1 In short, this growing wedge between a typical worker’s pay and economywide productivity is exactly what one would expect to see in the case where union strength was throttled.
An obvious question that arises is just how much of the growing wedge between typical workers’ pay and productivity can be explained by the declining strength of unions. Important work by Fortin, Lemieux, and Lloyd (2021) assesses this empirically. Figure D draws on work by Mishel (2021) that translates results from Fortin, Lemieux, and Lloyd (2021) into effects on median wages—those wages earned by the worker in the exact middle of the income distribution.
Union erosion was major cause of wage suppression in recent decades: Real median wages (in 2020$), actual and without effect of eroded unionization, 1979–2017
| Actual median hourly wage | Median hourly wage without union decline | |
|---|---|---|
| 1979 | $18.39 | 18.39 |
| 1988 | 17.83 | 18.65 |
| 2000 | 18.51 | 19.69 |
| 2017 | 19.70 [/hide-if pdf] |
21.27 [/hide-if pdf] |
| 2020 |
Note: Totals may not sum due to rounding.
Source: Author’s analysis of unpublished tabulations from Thomas Lemieux (2021) using model in Fortin, Lemieux, and Lloyd (2021).
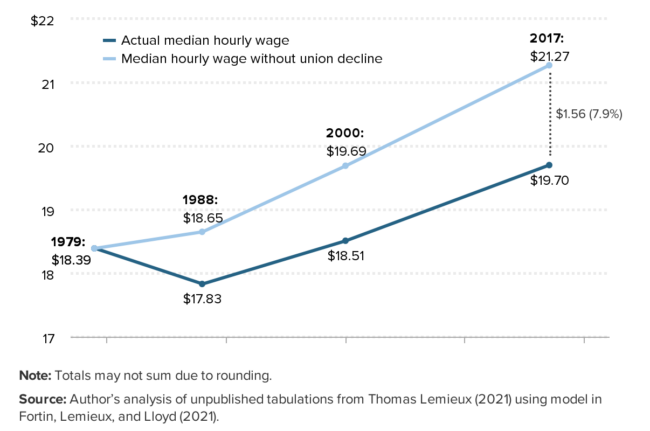
It shows that median wages by 2017 would have been 8% higher if the decline in unionization since 1979 had not occurred. For a full-time worker making the median wage, this translates into over $3,000 annually in lost wages. This would explain by itself roughly a fifth of the overall gap between typical workers’ pay and economywide productivity (Bivens and Mishel 2021).
This estimate is the direct effect of de-unionization in depriving formerly unionized workers of the union “wage premium” and the spillover effect of nonunion firms in unionized sectors no longer having to pay higher wages to workers. But it does not count harder-to-measure knock-on effects stemming from unions’ reduced influence in other policy debates.
Take just one example: unemployment insurance (UI). There are many reasons to believe that a more robust system of unemployment insurance might boost workers’ bargaining power. Workers would have a stronger fallback position if they are forced to leave a job. If workers could rely on adequate coverage from unemployment insurance, they would not be forced to accept the first job opportunity, regardless of whether it was a good fit for their skills and preferences. By many measures the protectiveness of the nation’s UI system has been severely degraded, making it far less important than it used to be as a bolster to workers’ bargaining power.
Organized labor has been by far the most important political champion of enhanced unemployment insurance in the U.S. economy in recent decades. But as organized labor shrinks and is forced to spend more resources trying to maintain its footholds in incumbent sectors, the resources to engage in key policy fights like those over unemployment insurance are stressed. Bivens and Mishel (2021) identify a number of anti-worker changes in policy and business practices that as a whole have contributed substantially to widening the wedge between economywide productivity and typical workers’ pay: measures like noncompete agreements, the use of contract firms to “fissure” workforces and deny some workers the benefits of working in highly productive firms, and forced arbitration clauses. In a world where union strength remained high after the 1970s, it seems very likely that some of these changes would have been more successfully resisted by workers, and hence the overall effect of declining union strength on typical workers’ pay is likely even larger than Figure D suggests.
A resurgence in collective action
Despite relentless attacks on unions over the last four decades, the U.S. labor movement has seen a resurgence in popularity in recent years. In 2022, more than 16 million workers in the United States were represented by a union—an increase of 200,000 from 2021 (Shierholz, Poydock, and McNicholas 2023). The National Labor Relations Board (NLRB), the agency tasked with conducting union elections and charging employers for violating labor law for private-sector workers, saw a 23% increase in its caseload during fiscal year 2022, which is the highest increase since 1959 (NLRB 2023). Further, the U.S approval rating of labor unions has grown steadily over the last five years (McCarthy 2022). The increased interest in unions is also evident in organizing drives, particularly among young workers, at well-known companies such as Starbucks, Amazon, and Trader Joe’s. Among the groups that have sought to organize in recent years are growing numbers of workers in universities, health care settings, electric vehicle factories, and museums (Greenhouse 2023).
In addition to forming unions, one of the most powerful forms of labor action is when workers go on strike. A strike is when workers withhold their labor from their employer for a period of time during a labor dispute. By withholding their labor—labor that employers depend on to produce goods and provide services—workers can counteract existing power imbalances between themselves and their employer. Strikes provide critical leverage to workers when they bargain with employers over fair pay and working conditions, when employers violate labor law, or when employers refuse to voluntarily recognize unions. A credible threat to strike often can be just as powerful as the strike itself, as demonstrated by Teamsters union members during their negotiations to secure a fair contract covering 340,000 UPS drivers this summer (Yurkevich and Isidore 2023).
As we see thousands of workers across the economy participate in labor actions this summer, it’s important to understand which groups have the right to strike, the different types of strikes, and the limitations workers face when they go on strike. Understanding this will help raise awareness about the obstacles and risks workers face when they go on strike.
Limitations on who has the right to strike
In the United States, most private-sector workers are guaranteed the right to strike under Section 7 of the National Labor Relations Act (NLRA). This section grants workers the right “to engage in other concerted activities [including the right to strike] for the purpose of collective bargaining or other mutual aid or protection.” The right to strike applies regardless of whether workers are in a union or are covered by a collective bargaining contract.
However, many U.S. workers have no legally protected right to strike because they are excluded from NLRA coverage due to long-standing racist occupational carve-outs (Perea 2011). Public-sector, agricultural, and domestic workers (including in-home health and child care workers) are not protected by the National Labor Relations Act, leaving states to set policy on union and collective bargaining rights for these occupations. A majority of states have enacted some form of collective bargaining framework for public-sector workers, but only a dozen states grant public-sector workers a right to strike, and often only under limited circumstances (Bass 2014; Sanes and Schmitt 2014).
Further, railway and airline workers are not covered under the National Labor Relations Act and instead have a far more limited right to strike under the Railway Labor Act (RLA) (FRA n.d.). The RLA requires workers to go through lengthy and complex steps in the bargaining process before they may legally pursue a strike. It also allows Congress to intervene in rail or airline labor disputes, as shown most recently in December 2022 when Congress passed legislation imposing an agreement between freight rail companies and 12 unions and making it illegal for the rail workers to strike (Kinery 2022).
Rail union negotiations powerfully illustrate both the potential power of worker collective action and the hostile policy environment disadvantaging many U.S. workers at the bargaining table. While facing a restrictive federal law that ultimately constrained their right to strike, rail workers’ threat to strike in 2022 nonetheless has drawn sustained national attention to long-standing worker concerns with safety, grueling work schedules, punitive attendance policies, and no paid sick leave. Leveraging this heightened attention (including from members of Congress and the White House) beyond the formal timeline of contract negotiations, rail workers have refused to accept an imposed contract settlement as the final word. Instead, workers continue to put pressure on rail carriers to address remaining demands, including for paid sick days (Whalen 2023)
Types of strikes
In general, there are three main types of strikes: economic strikes, unfair labor practice strikes, and recognition strikes. In an economic strike, workers withhold their labor as leverage when bargaining for better pay and working conditions. While NLRA-covered workers in economic strikes retain their status as employees and cannot be discharged, their employer has the right to permanently replace them. In many cases, unions negotiate return-to-work agreements covering all unit members as part of settling a contract when a strike concludes.
In an unfair labor practice strike, workers withhold their labor to protest their employer engaging in activities that they believe to be a violation of labor law. Workers in an unfair labor practice strike cannot legally be discharged or permanently replaced. Workers in both economic and unfair labor practice strikes are entitled to back pay if the National Labor Relations Board finds that the employer unlawfully denied the workers’ request for reinstatement after a strike ends and workers declare intent to go back to work.
Other lesser known, but still effective, forms of strikes include recognition strikes. As the name implies, recognition strikes are when workers withhold their labor to compel an employer to recognize and bargain with their newly formed union. While recognition strikes were more widely employed in the early to mid 20th century, they are a potentially powerful organizing tactic that several large groups of workers have employed in recent years (Labor Notes 2019; Poydock, Sherer, and McNicholas 2023).
First contract strike for Insider union
Workers also use strikes as a tool to reach a first contract with employers who fail to bargain in good faith or who delay the bargaining process. After two years of negotiations, workers at the digital news outlet Insider went on strike in June 2023 to reach a first contract. After 13 days on strike, the workers, who are represented by The News Guild of New York, reached a tentative agreement that includes a minimum wage floor of $65,000, wage increases of 10.25% over the length of the contract, just cause protections, and a layoff moratorium for the remainder of 2023 (The News Guild of New York 2023).
Limitations of strikes in the United States
Even for private-sector workers who are covered under the NLRA, federal policy and court decisions over decades have eroded legal protections and weakened the right to strike. For example, it is currently unlawful under the National Labor Relations Act for workers to be involved in “secondary” strikes, which are strikes aimed at an employer other than the primary employer (for example, when workers from one company strike in solidarity with another company’s workers). In addition, if a strike is deemed an “intermittent strike”—when workers intentionally strike on-and-off over a period of time—it is not protected as a lawful strike by the NLRA. In general, a strike is also unlawful during the period of time a collective bargaining agreement between a union and the employer is in effect if it contains a “no-strike, no-lockout” clause. (Once such an agreement has expired without agreement to a new contract, workers can legally strike.)
Moreover, striking workers are vulnerable to employer retaliation: Workers can lose their jobs or benefits or be held liable for economic damages to company property. Court rulings allowing employers to “permanently replace” workers who are on strike for economic reasons have diminished the NLRA’s original protection of the right to strike.2 It is also fully legal for employers to cut off health insurance and other benefits of workers (and their dependents) during a strike. And in all but two states (New York and New Jersey), striking workers are not eligible to apply for unemployment benefits. Most recently, the Supreme Court ruled in Glacier Northwest v. International Brotherhood of Teamsters that workers can be liable for economic damages caused by strikes in certain cases (Gerstein 2023).
Trends in strikes over the years
Despite the precarious nature of the right to strike, each year thousands of workers walk off the job to demand fair pay and safer working conditions. The Bureau of Labor Statistics documents major work stoppages, which include both strikes and lockouts, that involve 1,000 or more workers and last one full work shift between Monday-Friday, excluding federal holidays. As shown in Figure E, the number of workers involved in major work stoppages between 2018 and 2019 hit its highest levels in almost three decades. After subsiding in 2020 and 2021, the number of workers involved in major work stoppages grew by 50% in 2022 (Poydock, Sherer, and McNicholas 2023).
Number of workers involved in major work stoppages, 1973–2022
| Year | Number of workers |
|---|---|
| 1973 | 1,400,000 |
| 1974 | 1,796,000 |
| 1975 | 965,000 |
| 1976 | 1,519,000 |
| 1977 | 1,212,000 |
| 1978 | 1,006,000 |
| 1979 | 1,021,000 |
| 1980 | 795,000 |
| 1981 | 728,900 |
| 1982 | 655,800 |
| 1983 | 909,400 |
| 1984 | 376,000 |
| 1985 | 323,900 |
| 1986 | 533,100 |
| 1987 | 174,400 |
| 1988 | 118,300 |
| 1989 | 452,100 |
| 1990 | 184,900 |
| 1991 | 392,000 |
| 1992 | 363,800 |
| 1993 | 181,900 |
| 1994 | 322,200 |
| 1995 | 191,500 |
| 1996 | 272,700 |
| 1997 | 338,600 |
| 1998 | 386,800 |
| 1999 | 72,600 |
| 2000 | 393,700 |
| 2001 | 99,100 |
| 2002 | 45,900 |
| 2003 | 129,200 |
| 2004 | 170,700 |
| 2005 | 99,600 |
| 2006 | 70,100 |
| 2007 | 189,200 |
| 2008 | 72,200 |
| 2009 | 12,500 |
| 2010 | 44,500 |
| 2011 | 112,500 |
| 2012 | 148,100 |
| 2013 | 54,500 |
| 2014 | 34,300 |
| 2015 | 47,300 |
| 2016 | 99,400 |
| 2017 | 25,300 |
| 2018 | 485,200 |
| 2019 | 425,500 |
| 2020 | 27,000 |
| 2021 | 80,700 |
| 2022 | 120,600 |
Notes: The Bureau of Labor Statistics does not distinguish between strikes and lockouts in its work stoppage data. However, lockouts (which are initiated by management) are rare relative to strikes, so it is reasonable to think of the major work stoppage data as a proxy for data on major strikes. Data are for public- and private-sector workers.
Source: Bureau of Labor Statistics, “Major Work Stoppages in 2022” (news release), February 22, 2023, and related table, “Annual Work Stoppages Involving 1,000 or More Workers, 1947–Present.”
Preliminary monthly data from the Bureau of Labor Statistics indicate that the number of workers on strike in 2023 will exceed the number from 2022.3 This includes strikes involving Los Angeles Unified School District staff (CBS News 2023), Hollywood writers and actors (Roth 2023), and Mount Sinai Hospital nurses (Irizarry Aponte 2023). And these data provide only a partial picture of the current uptick in strike activity since BLS major work stoppages include only larger strikes (and the rare employer lockout) that last at least one full shift. An enormous amount of information is missed by restricting the data in this way. According to BLS data on firm size, nearly three-fifths (58%) of private-sector workers are employed by firms with fewer than 1,000 employees (BLS 2023a). These size and duration limits mean that the BLS data did not capture actions taken by many workers who walked off the job to demand fair pay and safe working conditions during the pandemic.
Strikes can be a powerful tool for workers when they bargain with employers over fair pay and working conditions, when employers violate labor law, or when employers refuse to voluntarily recognize unions. The following are recent examples of workers in a variety of industries who used the right to strike to secure better pay, benefits, and working conditions.
University of California graduate student workers
In November 2022, approximately 48,000 workers at the University of California’s 10-campus system went on strike. The workers, represented by the United Auto Workers, included teaching assistants, researchers, tutors, and other graduate student instructors (Gecker and Weber 2022). The workers voted to go on strike seeking to improve their pay and benefits; they cited as a concern the high cost of living in cities like Los Angeles and the San Francisco metro area where the university system’s campuses are located.
The six-week strike concluded when the United Auto Workers and the University of California agreed to contracts providing major wage increases, benefits to help workers cover child care and health care costs, and enhanced transportation stipends (Hubler 2022). The strike has been described as the largest higher education strike in U.S. history (Guardian 2022) and was the largest major work stoppage in 2022 (Poydock, Sherer, and McNicholas 2023).
The University of California strike is one of several strikes that involved graduate student workers in recent years. For example, graduate students at Indiana University (Smith 2022), Columbia University (Wong 2022), Fordham University (Wexler 2023), and the University of Illinois at Chicago (Grimm 2022) have gone on strike within the last year. More recently in June 2023, graduate student researchers at the University of Washington went on strike, successfully securing improved pay and layoff protections (Bryan 2023).
Memphis sanitation workers
In April 2023, 88 sanitation workers in Memphis, Tennessee, went on strike after weeks of contentious contract negotiations with their employer Republic Services. The workers, represented by Teamsters Local 667, voted to strike after one of their coworkers was killed on the job at a Memphis landfill in March 2023. The strike occurred 55 years after the 1968 Memphis sanitation worker strike, which was spurred by the death of two sanitation workers (Teamsters 2023).
As employees of private company Republic Services, this group of workers’ right to strike in 2023 was protected under the NLRA. The recent strike presents an important reminder of the contrasting conditions faced by Memphis city sanitation workers during the 1968 strike. Those workers were represented by AFSCME Local 1733 but had no legal protection to strike and no legal framework in place requiring the city to recognize and bargain with the union they had formed. The 1968 strike became a landmark struggle of Black public-sector workers for civil rights and union recognition in a state that to this day does not protect public employees’ right to strike (Sanes and Schmitt 2014; AFSCME 2023).
The 2023 strike concluded after nine days when the workers reached a tentative agreement with Republic Services. The agreement included wage increases of 28% for workers over the course of the five-year contract, increased bonus pay for the handling of asbestos, additional sick days, and more funding for safety equipment (Burgess 2023).
Oregon nurses
In May 2023, nearly 1,000 nurses at the St. Charles Medical Center in Bend, Oregon, authorized a strike after nearly six months of contract negotiations. Represented by the Oregon Nurses Association, an affiliate of the American Federation of Teachers, the nurses were seeking to raise safety standards, ensure their access to affordable health care and competitive wages to recruit and retain skilled staff.
Just days before the planned strike, St. Charles Medical Center and the Oregon Nurses Association reached a tentative agreement on a new contract (ONA 2023). The agreement included historic wage increases to help recruit new nurses, wage increases of over 30% for current nurses during the length of the contract, and protections for rest and meal breaks (McGee 2023). This is a prime example that a credible threat to strike can often provide workers the leverage they need to negotiate better pay and working conditions without ultimately having to strike.
Starbucks workers
In June 2023, more than 3,000 Starbucks workers across 150 stores went on strike in response to the company’s policy prohibiting Pride month decorations. The workers, represented by Starbucks Workers United, went on an unfair labor practice strike asserting that the policy change was made without consultation with the union and that the policy itself was an attack on queer workers. Starbucks Workers United claim that the June strike was the largest action in the union’s history (Goldsmith and Montgomery 2023).
Starbucks has consistently resisted its workers’ unionization efforts. Since December 2021, workers in 41 states, at 345 of Starbucks’s U.S.-based company-owned stores, have voted to unionize (More Perfect Union 2023). As of August 2023, Starbucks has refused to bargain in good faith with any of its unionized stores. National Labor Relations Board officials have issued 100 complaints alleging the company violated labor law, including a nationwide case charging Starbucks with illegal failure to bargain with stores across the country (Iafolla and Purifoy 2023).
Conclusion and policy recommendations
Labor actions that boost workers’ ability to bargain collectively are the only path that has ever led to broadly shared prosperity. What is equally clear from history, however, is that the desire of workers alone has never been sufficient to overcome employers’ resistance to unions. Workers’ efforts need to be supported by strong policy measures that re-level the playing field between workers and employers. Such policy measures built a strong U.S. middle class during the “Great Compression,” and their erosion must be reversed if we want another long period of broadly shared prosperity going forward.
The following are federal policies that would strengthen workers’ right to join unions and bargain collectively.
- The Richard L. Trumka Protecting the Right to Organize (PRO) Act includes critical reforms that would strengthen private-sector workers’ right to strike. The PRO Act would expand the scope for strikes by eliminating the prohibition on secondary strikes and by allowing the use of intermittent strikes. It would also strengthen workers’ ability to strike by prohibiting employers from permanently replacing striking workers.
- The Striking and Locked Out Workers Healthcare Protection Act would prevent employers from cutting off health coverage of workers and family members in retaliation against striking workers.
- The Food Secure Strikers Act would allow striking workers to qualify for Supplemental Nutrition Assistance Program (SNAP) benefits.
- Congress should also pursue policies that extend a fully protected right to strike to railway, airline, public-sector, agricultural, and domestic workers. None of these workers has the fundamental right to strike.
Gaps and exclusions in federal labor law mean states continue to play crucial roles in ensuring workers’ right to strike. State legislatures should protect the right to strike for public-sector, agricultural, and domestic workers who are excluded from federal labor law. Right now, only a dozen states grant limited rights to strike to public-sector workers, and in some states like Ohio, recently proposed legislation has threatened even these limited existing protections (Trau 2023). More states should also join New York and New Jersey in making striking workers eligible for unemployment benefits.
Notes
1. See Huang et al. 2017 and DiNardo, Hallock, and Pischke 2000 on the link between unionization and lower pay for corporate managers, and Lee and Mas (2012) on the effect of newly organized unions and firms’ equity value.
2. In NLRB v. Mackay Radio & Telegraph Co., the U.S. Supreme Court stated that employers were not violating the law by hiring people to take the places of striking workers and then keeping those workers on after the strike is over, thus permanently replacing the striking workers. While this statement was incidental to the issue at hand in Mackay and had no impact on the ruling in that case, it has been used to justify the permanent replacement of strikers ever since.
3. EPI analysis of the BLS detailed monthly listings data (BLS 2023b).
References
American Federation of State, County and Municipal Employees (AFSCME). 2023. I Am Story (podcast). Launched March 2023.
Bass, Kirsten. 2014. “Overview: How Different States Respond to Public Sector Labor Unrest.” On Labor, March 11, 2014.
Bivens, Josh, and Lawrence Mishel. 2021. Identifying the Policy Levers Generating Wage Suppression and Wage Inequality. Economic Policy Institute. May 13, 2021.
Bryan, Claire. 2023. “UW Researchers, Engineers, Postdocs Ratify Contracts, End Strike.” Seattle Times, June 21, 2023.
Bureau of Labor Statistics (BLS). 2023a. “Table F. Distribution of Private Sector Employment by Firm Size Class: 1993/Q1 Through 2022/Q1, Not Seasonally Adjusted” (table). National Business Employment Dynamics Data by Firm Size Class, accessed on August 24, 2023.
Bureau of Labor Statistics (BLS). 2023b. “Detailed Monthly Listing, 2023,” Worker Stoppages [Excel file], accessed August 21, 2023.
Burgess, Katherine. 2023. “Sanitation Workers Reach Agreement with Pay Increases, More After Nine-Day Strike.” Commercial Appeal, April 22, 2023.
CBS News. 2023. “Deal Reached After Strike Which Shuttered Los Angeles Schools for 3 Days.” March 24, 2023.
Congressional Budget Office. 2022. The Distribution of Household Income, 2019.
DiNardo, John, Kevin Hallock, and Jorn-Steffen Pischke. 2000. Unions and the Labor Market for Managers. Manuscript, London School of Economics.
Farber, Henry S., Daniel Herbst, Ilyana Kuziemko, and Suresh Naidu. 2021. Unions and Inequality over the Twentieth Century: New Evidence from Survey Data. Quarterly Journal of Economics. Volume 136, no. 3.
Federal Railroad Administration (FRA). n.d. Highlights of the Railway Labor Act (“RLA”), and the U.S. Department of Transportation’s (“DOT”) Role in RLA Disputes. Office of Policy, Office of Rail Policy and Development, Federal Railroad Administration.
Fortin, Nicole, Thomas Lemieux, and David Lloyd. 2021. Labor Market Institutions and the Distribution of Wages: The Role of Spillover Effects. Journal of Labor Economics. Volume 39, no. 52.
Gecker, Jocelyn, and Christopher Weber. 2022. “48,000 University of California Academic Workers on Strike.” Associated Press, November 14, 2022.
Gerstein, Terri. 2023. “The Supreme Court Sided with Corporations Over Workers—Again.” Working Economics Blog (Economic Policy Institute), June 9, 2023.
Goldsmith, Eloise, and Rohan Montgomery. 2023. “For Queer Starbucks Workers, Pride Month Is Strike Month.” The Nation, June 30, 2023.
Gould, Elise, and Jori Kandra. 2022. “Inequality in Annual Earnings Worsens in 2021.” Economic Policy Institute. December 21, 2022.
Greenhouse, Steven. 2023. “Focus Organizing Drives on Workers Without College Degrees, US Unions Told.” Guardian, May 5, 2023.
Grimm, Andy. 2022. “UIC Grad Student Workers End Strike.” Chicago Sun-Times, April 26, 2022.
Guardian. 2022. “Largest-Ever US Higher Education Strike Ends After ‘Landmark’ Deal.” December 27, 2022.
Hubler, Shawn. 2022. “University of California Academic Workers End Strike.” New York Times, December 23, 2022.
Huang, Qianqian, Feng Jiang, Erik Lie, and Tingting Que. 2017. The Effect of Labor Unions on CEO Compensation. Journal of Financial and Quantitative Analysis. Volume 52, no. 2.
Iafolla, Robert, and Parker Purifoy. 2023. “Starbucks Is Racking Up Labor Law Violations as Rulings Roll In.” Bloomberg Law, June 2, 2023.
Irizarry Aponte, Claudia. 2023. “Nurses End Strike, Reach Tentative Agreements with Montefiore and Mount Sinai Hospitals.” The City, January 12, 2023.
Jaumotte, Florence, and Carolina Osorio Buitron. 2015. Inequality and Labor Market Institutions. International Monetary Fund (IMF) Staff Discussion Note.
Kinery, Emma. 2022. “Biden Signs Bill Averting Rail Worker Strike Despite Lack of Paid Sick Days.” CNBC, December 2, 2022.
Labor Notes. 2019. “Ways to Strike.” October 17, 2019.
Lee, David, and Alexandre Mas. 2012. Long-Run Impacts of Unions on Firms: New Evidence from Financial Markets, 1961-1999. Quarterly Journal of Economics, Volume 127, no. 1.
Lemieux, Thomas. 2021. Unpublished Excel files provided by Thomas Lemieux, using the model and data in Fortin, Lemieux, and Lloyd (2021).
McCarthy, Justin. 2022. “U.S. Approval of Labor Unions at Highest Point Since 1965.” Gallup, August 30, 2022.
McGee, Kelsey. 2023. “St. Charles Bend Nurses Union, Hospital Reach Contract Deal to Avert Strike After Marathon Talks.” KTVZ, June 9, 2023.
Mishel, Lawrence. 2021. The Enormous Impact of Eroded Collective Bargaining on Wages. Economic Policy Institute. April 8, 2021.
More Perfect Union. 2023. “Map: Where Are Starbucks Workers Unionizing?” (web page). Last updated August 9, 2023.
National Labor Relations Board (NLRB). 2023. “Unfair Labor Practices Charge Filings Up 16%, Union Petitions Remain Up in Fiscal Year 2023” (news release). April 7, 2023.
The News Guild of New York Local 31003, CWA. 2023. “Insider Union Wins Historic Contract After 13-Day Strike” (news release). June 14, 2023.
Oregon Nurses Association (ONA). 2023. “Nurses and Management at St. Charles Medical Center in Bend Reach Tentative Agreement, Strike Averted” (news release), June 8, 2023.
Perea, Juan F. 2011. “The Echoes of Slavery: Recognizing the Racist Origins of the Agricultural and Domestic Worker Exclusion from the National Labor Relations Act.” Ohio State Law Journal 72, no. 1.
Poydock, Margaret, Jennifer Sherer, and Celine McNicholas. 2023. Major Strike Activity Increased Nearly 50% in 2022. Economic Policy Institute, February 2023.
Roth, Emma. 2023. “Hollywood’s Writers and Actors Are on Strike.” The Verge, August 7, 2023.
Sanes, Milla, and John Schmitt. 2014. Regulation of Public Sector Collective Bargaining in the States. Center for Economic and Policy Research (CEPR), March 2014.
Shierholz, Heidi, Margaret Poydock, and Celine McNicholas. 2023. Unionization Increased by 200,000 in 2022. Economic Policy Institute, January 2023.
Smith, Rachel. 2022. “Indiana University Graduate Workers Vote Against Fall Strike. Is the Labor Dispute Over?” Herald-Times, September 27, 2022.
Teamsters. 2023. “Teamsters Local 667 Members Win Massive Wage Increases, Safety Bonus” (news release), April 24. 2023.
Trau, Morgan. 2023. “Ohio Labor Unions Fight Back Against Higher Education Bill Banning Strikes.” Ohio Capital Journal, May 31, 2023.
Whalen, Eamon. 2023. “Railroad Workers Kept Applying Pressure for Sick Days. It’s Working.” Mother Jones, June 26, 2023.
Wexler, Sara. 2023. “Fordham Graduate Workers Just Went on Strike for Their First Contract.” Jacobin, May 5, 2023.
Wong, Ashley. 2022. “Student Workers at Columbia End 10-Week Strike After Reaching a Deal.” The New York Times, January 7, 2022.
Yurkevich, Vanessa, and Chris Isidore. 2023. “UPS and Teamsters Reach a Labor Deal, Potentially Avoiding a Crippling Strike.” CNN, July 25, 2023.