Issue Brief #233
A 1980s ad campaign for Isuzu cars (remember Joe Isuzu?) famously conveyed the message that good products should not need wild exaggerations told on their behalf to convince the public of their virtue.
This bit of wisdom is oddly useful to keep in mind during the recent stepped-up debates over proposed new trade agreements. Advocates of signing as many of these agreements as quickly as possible (regardless, apparently, of their actual content) have made arguments about globalization’s benefits whose audacity would make Joe proud. A sample:
“…elimination of remaining global barriers [to trade flows] would add another $500 billion to annual income or $4,500 per U.S. household.”(Testimony of the U.S. Trade Representative to the Senate Finance Committee, February 15, 2007)
“But this complacency is wrong. The Peterson Institute for International Economics calculates that the removal of remaining trade barriers would boost U.S. income by $500 billion a year.” (Sebastian Mallaby)
“And the answer there was that a means to truly global free trade would enhance the U.S. standard of living by another half trillion dollars a year, another 500 billion [dollars] per year.” (Fred Bergsten)
Five hundred billion dollars is a lot of money—roughly 4% of the entire economy of the United States. Is it a generally accepted proposition by economists that trade liberalization should be expected to add this much to the U.S. economy?
The answer is pretty simple: nope. Just like the Isuzu Trooper was big, yet did not have as many seats as the Astrodome, trade liberalization’s benefits, while real, are not near as large as more zealous advocates claim.
What do most studies say about the benefits of trade liberalization?
The United States International Trade Commission (USITC) periodically releases a comprehensive report, The Economic Effects of Significant U.S. Import Restraints, which essentially assesses how much removing all remaining barriers to imports into the United States would add to gross domestic product (GDP). The latest edition puts this number at $3.7 billion, or less than 1% of what the above advocates claim.
Two other well-known models used to calculate the gains resulting from complete trade liberalization spit out roughly similar results. The Global Trade Analysis Project (GTAP) estimates U.S. gains of close to $8 billion (less than 2% of the claims above). The World Bank’s LINKAGE model has estimated that the United States would gain about $16.2 billion (less than 4% of the claims above).
What does economic theory tell us about gains to expect from liberalization?
There is a quick and easy way, following mainstream trade theory, to estimate prospective gains from further trade liberalization. What follows is a quick calculation using the theory of (static) comparative advantage. This theory is sometimes caricatured as staid and somehow obsolete in capturing the full range of ways in which trade can add benefits to the U.S. economy.
Arguments over hipness aside, this theory remains the intellectual foundation of the economic case for trade liberalization. Arguing that liberalization’s benefits far exceed what this theory predicts requires that one get awfully creative, and creativity in trade theory works both for and against the simple policy recommendation that liberalization is best policy always and everywhere. In short, the calculation below is the most reliable method of predicting the benefits of liberalization—everything over and above this is interesting and should be explored but cannot be considered conclusive.
The United States today has an average tariff rate of less than 2%. This low average rate may mask some higher peak tariffs on particular goods and non-tariff barriers that keep imports out the country. Say (generously to the case for trade liberalization) that the effective tariff rate into the U.S. economy is five times as large as the simple average—the equivalent of a 10% tariff on all imports (most estimates of the effective rate of protection are actually only around twice as high as theaverage rate). One can then calculate what removing all of these trade barriers would imply for U.S. income.
With a 10% tariff, some goods are produced domestically even though they could be produced for 10% less abroad. Some goods, however, are produced domestically but would only be 1% cheaper if purchased abroad. Using the midpoint, it can be assumed that removing a 10% tariff lowers the average price of imports by 5%.
Next, one estimates how much imports will increase following the tariff cut. The relevant academic literature argues that three is a pretty generous estimate of the elasticity of imports with respect to tariff cuts (this is essentially a measure of how robustly imports respond to cuts in tariffs), so imports will rise from the current 18.0% of GDP to 23.4%—that is, they rise by 30%, the product of the fall in import prices due to the tariff cut (10%) times the elasticity of import demand (3).
Now each parameter needed to calculate the gains from liberalization is in place. From here, just multiply the decrease in import prices by the increase in imports resulting from the tariff cut to yield the estimate of the gains from trade liberalization: 5.0% times 5.4% equals 0.26% of GDP, or, roughly $30 billion. This is the rough estimate that can be banked. The other $470 billion needs a lot of explaining.
Where does the $500 billion number come from?
A 2005 study by Bradford, Grieco, and Hufbauer (BGH, henceforth), published by the Peterson Institute for International Economics, is the source of the claim that future trade agreements can yield $500 billion in extra income for the United States. BGH undertake no original number-crunching in arriving at these numbers (which is no sin—review and interpretation definitely count as research); instead they invoke two independent studies on trade gains to justify the $500 billion estimate of prospective increases from liberalization.
The first one was a 2001 study by Brown, Deardorff, and Stern (BDS, henceforth) using the Michigan Model of World Production and Trade. The second is a 2004 study by Bradford and Lawrence (BL, henceforth). Results from both studies regarding the gains from trade are premised overwhelmingly on the assumption that barriers to trade exist even when no explicit price or quantity restrictions on imports or foreign investment can be identified.
For example, BDS estimate that about 85% of projected U.S. gains from future trade liberalizations will come from liberalization of the service sector. This will surprise many, since it is not common to think of the U.S. service sector as benefiting greatly from trade protection. However, BDS use a very expansive definition of protection to get their results.
Essentially, they look at gross operating margins across industries and countries. As a baseline, they take the lowest gross operating margin that exists in any country for each particular industry, and from there they assume that the difference between this and operating margins in the same industry located in other countries is solely the result of a policy barrier to trade that can be removed.
This method yields the hard-to-believe result that the service sector in the United States is notably inefficient and protected relative to the rest of the world, ranking ninth out of 14 countries (see Table 1, first column). Even Japan, whose service sector is widely considered closed to foreign competition, ranks as more open than the United States, using gross operating margins as the relevant measure.
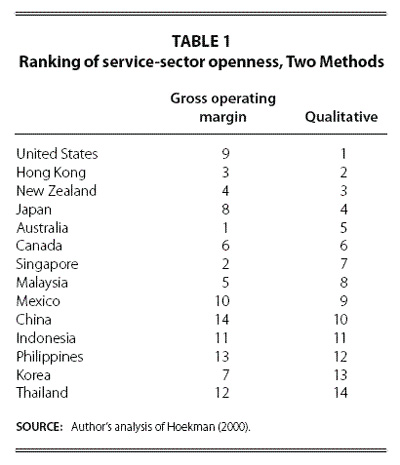
Dorman (2001) notes that BDS cite Hoekman (2000) as the source for this methodological approach. However, Hoekman (2000) actually cites this approach as just one of many. Another method used by Hoekman (2000) is to identify actual trade barriers and weight them according to interviews with selected businesses who work in the protected areas.
Using this approach, the United States is by far the least protected service market identified, not more restrictive than the average, which the BDS results suggest (see Table 1, second column). This second approach implies very little gain to the United States from further liberalizing its service sector, as access to it is already as free as the global economy allows anywhere.
Further, as noted in this context by Baker and Weisbrot (2002), it is a general fact that even different firms within the same industry in a given country often have very different gross operating margins: Safeway’s margin (29%) is over 50% higher than its industry average (18%). Target’s margin is 50% greater than Wal-Mart’s, yet very few people think there are explicit policy barriers to Target competing with Wal-Mart within the United States.
BDS acknowledge that their method does not provide an airtight estimate of the trade barriers faced by service-sector firms, allowing that “these estimates of services barriers are intended to be indirect approximations of what the actual barriers may in fact be” (BDS 2001, 18).
When the World Bank (2002) adopted a similar approach to forecasting gains from service trade, and, it noted “the quantification of services sectors’ trade barriers and other forms of protection is still more art than science” (World Bank 2002, 170).
Art has its place. But it is not in policy debates that should be largely based in numbers that we know about, not those that we imagine we see in the gaps.
The BL study takes price differences between commodities classified similarly (T-shirts, say) as evidence of barriers to trade that should erode these differences, again, without actually pointing to identifiable trade barriers.
Furthermore, while the BL study does not examine the service sector, BGH “scale up” the BL results on merchandise trade by looking at the ratio of service sector to merchandise liberalization benefits identified by BDS. What looks to be a robust result (two studies converging on a common number for what future trade agreements can bring the U.S. economy) turns out to hinge mostly on how convincing only one of the studies is.
Growth versus distribution
Lastly, it should be noted that the same theory that argues unambiguously that trade is “win-win” in terms of total national income argues just as strongly that trade is “win-lose” for productive factors located within countries (the Stolper-Samuelson Theorem). Numerous studies have confirmed the predicted result of this theorem (if disagreed on the magnitude of the effect) that falling trade costs (liberalization) are associated with widening inequality and absolute wage losses for blue-collar and non-managerial labor in the United States (i.e., about three-fourths of the private-sector workforce).
This completely standard result is distorted by BGH, whose characterization of that group losing from expanded trade (concentrated) and the scale of losses (small, relative to net benefits) is literally the opposite of what is predicted by mainstream trade theory.
BGH justify characterizing trade’s losers as “small” and “concentrated” by examining only those workers directly displaced by trade. This group generally never shows up in most trade theories, which assume full-employment always and everywhere. Displacement, in short, while a real-world problem, is decidedly not the biggest cause of income losses due to trade and trade liberalization.
Rather, the largest cost from trade is the permanent and steady drag on the wages of all American workers whose education and skills resemble those displaced by trade. Waitresses, for example, do not generally lose their jobs due to trade, but their pay suffers as workers displaced from tradeable goods industries crowd into their labor market and bid down wages.1 Not acknowledging these wage costs is a very good way to minimize the total debit column in the balance sheet of globalization’s impact on American workers.
Lastly, and, most important, mainstream trade theory predicts that the larger the gains from trade, the larger the re-distribution of income and the larger the gross losses inflicted. Even worse, this theory predicts that more income will be re-distributed than created because of trade (one aspect of the so-called “magnification effect”). Given this, it is hugely inaccurate to refer to the losses spurred by trade as either small or concentrated.
Conclusion
Economic theory and evidence provide plenty of ammunition to support cutting trade barriers. One can stipulate that economic theory predicts that removal of trade barriers leads to higher national incomes. Erecting trade barriers as a policy response to the problems introduced to American workers through globalization is far from an optimal solution, and stipulating this moves the debate along to more contested areas—such as the fact that economic theory and evidence also provide plenty of evidence to raise as many concerns about the distribution of income as its overall growth.
Occasionally, however, zealous advocates go far past what sound evidence argues in making the case for trade. The $500 billion figure reputed to be the future gains from trade liberalization is clearly meant to stifle, not inform, debate. It should be retired from future trade policy discussions.
Endnotes
1. This is not necessarily the exact channel through which globalization pushes down wages even in non-traded sectors, but it is close enough to serve as a short-hand description.
References
Anderson, Kym, Will Martin, and Dominique van der Mensbrugghe. 2006. Distortions to world trade: Impacts on agricultural markets and farm incomes from full trade liberalization. Review of Agricultural Economics. Vol. 28, No. 2, pp. 168–94.
Baker, Dean, and Mark Weisbrot. 2002. The Relative Impact of Trade Liberalization on Developng Countries. Center for Economic Policy Research Briefing Paper. Washington, D.C.: CEPR.
Bergsten, Fred. 2006. America and the World Economy: A Strategy for the Next Decade. Transcript found at: http://www.cfr.org/publication/7786/america_and_the_world_economy.html?breadcrumb=/bios/257/peter_g_peterson
Bradford, S
cott, Paul Grieco, and Gary Hufbauer. 2005. “The Payoff to American from Global Integration.” In Bergsten (ed.), The United States and the World Economy: Foreign Economic Policy for the Next Decade. Washington, D.C.: Peterson Institute for International Economics.
Bradford, Scott C., and Robert Z. Lawrence. 2004. Has Globalization Gone Far Enough? The Costs of Fragmented Markets. Washington: Peterson Institute for International Economics.
Brown, Drusilla K., Alan V. Deardorff, and Robert M. Stern. 2001. CGE Modeling and Analysis of Multilateral and Regional Negotiating Options. Research seminar in International Economics Discussion Paper 468. Ann Arbor, Mich.: University of Michigan School of Public Policy. January.
Dimaranan, Betina, Thomas Hertel and Will Martin. 2002. “Potential Gains from Post-Uruguay Round Trade Reform: Impacts on Developing Countries.” In A. McCalla and J. Nash (eds.), Reforming Agricultural Trade for Developing Countries: Quantifying the Impacts of Multilateral Trade Reform. Chapter 6.
Dorman, Peter. 2001. The Free Trade Magic Act. Economic Policy Institute Briefing Paper. Washington, D.C.: EPI.
Hoekman, Bernard. 2000. The next round of services negotiations: Identifying priorities and options. Federal Reserve Bank of St. Louis Review. Vol. 82, pp. 31-47.
Mallaby, Sebastian. 2007. Free trade: Pause or fast-forward. The Washington Post. March 2, A15.
World Bank. 2002. Global Economic Prospects and the Developing Countries 2002. Washington, D.C.: World Bank.
