Full Report
Abstract
The Civil Rights Movement ushered in a new chapter in American history. The combined efforts of many moved the U.S. Congress to pass sweeping civil rights legislation to reverse oppressive Jim Crow laws and broadly combat discrimination against people of color.
While this movement succeeded in removing key barriers to equal rights under the law, many economic demands were left unmet. Failure to address these has adversely impacted the economic security of people of color and exacerbated many of the long-standing racial disparities in economic outcomes present today.
This report examines the difficult relationship between public policy and racial inequality in the United States. First, the report briefly outlines the history and evolution of structural racism from Reconstruction to the beginning of the Civil Rights Movement. Next, the report explores the policy demands the Civil Rights Movement championed through the March on Washington and the Kerner Commission. Then, the report examines whether federal policies implemented since the civil rights era have supported or undermined the demands from that period and the effects that those policies have had on the economic status of Black Americans. Finally, the report outlines ways in which policymakers can improve the lives of Black Americans and fulfill the civil rights era promise of racial equity.
This examination focuses mostly on Black Americans’ outcomes, given their central role in motivating the civil rights legislation designed to reverse the harm that Jim Crow legislation inflicted on the Black community. To assess Black Americans’ economic standing over the decades, the report analyzes changes in their unemployment rate, median hourly wages, union coverage, wealth, and homeownership rate. The report also examines access to basic rights and freedoms, measured by changes in voter registration, voter participation, and incarceration rates.
Past public policy laid the groundwork for the pervasive economic inequality that many people of color face today. Race-neutral legislation intended to help families earning low incomes and alleviate economic strain among middle-class households has only mitigated racial economic disparities slightly. That’s because these disparities are the result of policies that denied Black families the opportunity to build wealth and economic stability and fully participate in American society. Racial economic inequalities will persist without legislation explicitly targeting and remedying the injustices left unresolved by race-neutral policies, which disregard the challenges that specific racial or ethnic groups face.
In contrast, race-conscious policies acknowledge the historical and systemic disadvantages these groups endure and strive to address those disparities. These policies offer support to communities that have historically faced marginalization. The U.S. can achieve the dream of racial equity and justice through the implementation of race-conscious policies.
The history and evolution of structural racism in the U.S.
The United States was founded on the pillars of equality, opportunity, and prosperity for all. Yet throughout its history, the nation has struggled to live up to these ideals.
From slavery to Jim Crow segregation, systemic racism has been at the heart of policy decisions that deprived Black Americans and other people of color of economic opportunity, security, and freedom. This history of racial injustice and economic inequality is embedded within American attitudes, ideas, institutions, and policies that together preserve a racial hierarchy established during this nation’s early years.
Key moments in American history laid the foundation for structural racism, enabling and perpetuating racist policies that hinder the progress of Black Americans today. This section provides a historical overview from the end of the Civil War through the civil rights era.
Reconstruction (1865–1877)
Immediately following the Emancipation Proclamation and the end of the Civil War, Congress was seeking to rebuild a divided nation and integrate formerly enslaved people and white Southerners into a post-slavery society. During this period, Congress created the Freedman’s Bureau, which provided food, housing, medical aid, and land settlements to formerly enslaved people. Congress also passed the 14th Amendment, which gave formerly enslaved people citizenship, and the 15th Amendment, which granted formerly enslaved men the right to vote.
The period from 1867 to 1877 was known as the Radical Reconstruction. During this time, Black men were allowed to vote, actively participate in the political process, acquire the land of former slaveowners, seek their own employment, and use public accommodations (LOC 2023).
The rise and persistence of Jim Crow laws (1877–1960s)
Many Southern whites opposed the progress being made by Black Americans and reacted with both political and physical violence toward Black Americans. This backlash culminated in the passage of Jim Crow laws that were upheld by the 1895 U.S. Supreme Court case Plessy vs. Ferguson (National Constitution Center 2023). This ruling allowed states and localities to continue implementing and enforcing racial segregation if institutions supplied separate, but equal, services for each race.
These laws were later echoed in exclusions strategically denying many Black Americans the economic benefits provided by bills such as the Fair Labor Standards Act of 1938, the G.I. Bill, and the New Deal. These policies maintained economic and political disenfranchisement for Black Americans, thus limiting their rights and freedoms and enabling decades of racial segregation and economic oppression.
Civil rights era (1950s and 1960s)
The movement for desegregation and legal protections against discrimination affected a critical shift politically in the U.S. during the civil rights era (early 1950s to late 1960s). During this time, grassroots community organizing and protests for equal rights under the law fueled the public pressure that finally brought legislative change.
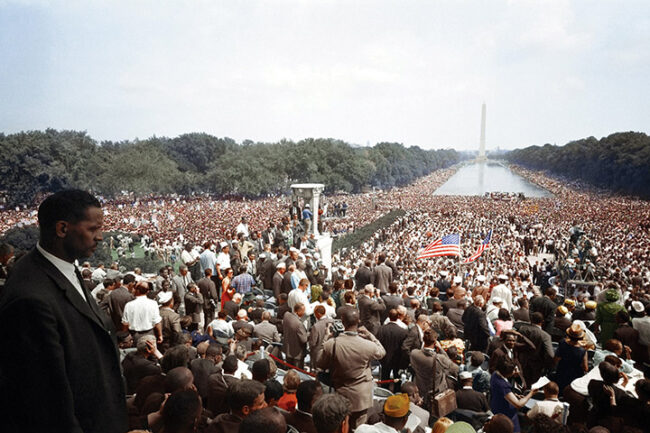
View of the crowd from the Lincoln Memorial to the Washington Monument, during the August 28th, 1963 March on Washington. Photo by Warren K. Leffler.
The civil rights era led to the enactment of inclusive legislation that outlawed segregation and employment discrimination, dismantled legal barriers to voter registration, and challenged the denial of basic human rights. The 1960s were noteworthy for the passage of the Civil Rights Act of 1964, the Voting Rights Act of 1965, and the Fair Housing Act of 1968. Additionally, Executive Order 12246 instituted affirmative action as a federal policy in 1965. This policy mandated that employers take proactive steps to ensure the fair treatment and employment of job seekers and employees, regardless of their race, color, religion, sex, or national origin.
This period marked a time in which the Black community publicly asserted their right to be treated as equal citizens in the United States. The 1963 March on Washington for Jobs and Freedom embodied these demands, which included fair access to housing, a sufficient minimum wage, equal employment, voting rights, and expansion of the Fair Labor Standards Act (Robinson and Rustin 1963). Toward the end of the 1960s, these demands were reiterated in recommendations from the 1968 Report of the National Advisory Commission on Civil Disorders—also known as the Kerner Commission—which was established to assess the key issues facing Black Americans and the causes of “race riots” in cities across the country.
Despite a brief period of progress for Black Americans immediately following the ratification of civil rights legislation, ongoing improvements were not sustained in the following decades, and many of the key demands of the movement were left unaddressed (Austin et al. 2013). This report examines some of the remaining demands and the crucial role that policy has played in shaping the deeply entrenched inequities experienced by Black Americans and in exacerbating structural barriers to prosperity for all people of color. The absence of targeted, race-conscious policy solutions to these barriers has created even more distance between communities of color and equal opportunity within the labor market and the overall economy.
The March on Washington
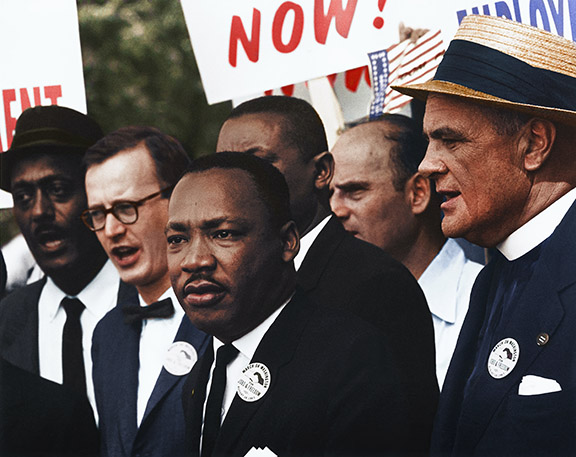
Dr. Martin Luther King, Jr. at the Civil Rights March on Washington. Photo taken by Rowland Scherman on August 28th, 1963, in Washington D.C.
On August 28, 1963, over 200,000 demonstrators participated in the March on Washington for Jobs and Freedom in Washington, D.C. Though the event is remembered for Dr. Martin Luther King Jr.’s “I Have a Dream” speech, the goals of the protest were largely economic. Leading up to the event, Black Americans faced dismal conditions: The Black unemployment rate was consistently high, and the community suffered from low wages and poor job mobility, systematic disenfranchisement through rampant voter suppression, and persistent racial segregation in the South (King Institute 2023). Discussions of these barriers crystallized around a large-scale march to call for both racial and economic justice. The goals of the protest included:
- A national minimum wage act that would “give all Americans a decent standard of living”
- “Comprehensive and effective” civil rights legislation to guarantee the right to vote, decent housing, adequate and integrated education, and equal access to all public accommodations
- A broadened, more inclusive Fair Labor Standards Act that would include all areas of employment that were presently excluded
- A massive federal program to train and place unemployed workers
Following the historic march, civil rights leaders met with President Kennedy to advocate for legislation that addressed these demands. Within a few years, the Civil Rights Act of 1964, the Voting Rights Act of 1965 and the Fair Housing Act of 1968 were passed, reflecting many of the demands outlined during the March on Washington.
The unanswered call of the Kerner Commission
Shortly after the monumental civil rights bills passed, civil and racial tensions reached an all-time high. In the summer of 1967, there were close to 160 race riots in cities across the nation (Britannica 2023). These riots surged the following year after the assassination of Dr. Martin Luther King Jr.
To better assess the root causes of the civil and racial unrest, President Lyndon Johnson established the National Advisory Commission on Civil Disorders, popularly known as the Kerner Commission, to investigate the riots and the core issues facing Black Americans (Haberman 2020). Their report named “white racism” as the primary culprit for the Black community’s frustration, which corresponded with systemic discrimination in employment, education, and housing. The report offered many recommendations to mitigate these issues, including calling for the creation of new jobs and the construction of new housing to disrupt residential segregation. Some of the recommendations specific to economic empowerment included (Haas 2018):
- Increasing the minimum wage and widening its coverage
- Strengthening federal, state, and local efforts to ensure equal opportunity
- Intensifying efforts on behalf of the Department of Labor to secure commitments from unions to encourage [Black] membership
- Creating 1 million jobs in both the public and private sectors within three years
- Enacting a national, comprehensive, and enforceable open occupancy [Fair Housing] law and expanding the supply of low-income housing
- Increasing work incentives and training, which included offering job training, providing day care centers for children, and allowing recipients to retain a greater part of their earnings
Unfortunately, President Johnson rejected and largely ignored the Kerner Commission’s recommendations, thus failing to address the social and economic needs of Black families in 1968 and beyond.
Many of the concerns and recommendations the Kerner Commission outlined in their report echoed the demands of the 1963 March on Washington for Jobs and Freedom. These issues continue to plague Black Americans and other marginalized people today. Lack of access to good jobs, fair wages, homeownership, and affordable housing contributes to worsening racial disparities.
Structural racism has worsened disparities
The Civil Rights Movement brought forth pivotal policies aimed at creating opportunities for Black workers and their families. Shortly after the passage of these bills, Black workers saw notable gains in earnings as previously denied employment and educational opportunities were made available. But the roots of structural racism run deep. Without addressing most of the core demands of the March on Washington or the suggestions from the Kerner Commission Report, many well-intended policies have done little to break down the stubborn barriers to economic prosperity for Black workers.
This section examines federal policies enacted in the aftermath of the civil rights era to boost equal employment opportunities and fair compensation, fair access to housing and wealth distribution, and fundamental rights and freedoms. Additionally, this section analyzes the data within these core categories to highlight the enduring presence of racial disparities over time.
Equal employment and fair pay
In the late 1960s and early 1970s, Black workers began to experience some measurable gains in the economy and labor market following civil rights era shifts in policy. From 1972 to 1980, the number of employed Black workers increased by 1.3 million, or 17% (Westcott 1982). These gains were particularly found in occupations from which Black workers had been excluded in the past, including professional and technical, managerial and administrative, sales, and clerical jobs.
Despite these gains and shifts in the types of jobs they held, Black workers continued to face large disparities in employment and earnings.
Persistently high unemployment rates for Black workers
Black workers have consistently experienced unemployment rates that are roughly twice as high as those faced by white workers (Gould and Wilson, 2020). This unfortunate yet defining feature of the U.S. labor market is documented in federal statistics dating back to 1954 when the Bureau of Labor Statistics first published “white and nonwhite” unemployment rates (Wilson and Darity 2022). In 1963, the year of the March on Washington, the unemployment rate was 5.0% for whites, but 10.9% for Blacks—or more than two times as high as the white rate. Following the passage of civil rights legislation and aided by a strong economic expansion, Black communities saw a decline in unemployment and an expansion of labor market participation. However, Black communities continued to bear more of the burden of unemployment.
Limited access to higher education among Black Americans and the resulting racial education or skills gaps are often cited as a major factor behind racial disparities in unemployment (Wilson and Darity 2022). However, major strides in high school and college completion since the 1960s have done little to equalize average Black and white unemployment rates. Black-white gaps in unemployment also exist at every level of education. These patterns, along with field experiments that reveal evidence of racial biases in hiring, point to the enduring effect of racial discrimination on persistently high levels of Black unemployment.
Even during some of the worst economic downturns of the last 50 years, the annual white unemployment rate has never been higher than 10%. The annual Black unemployment rate, however, reached 19.5% at its peak in 1983, compared with the record-high 8.7% annual unemployment rate for white workers in 2010 (BLS 2022a, 2022b). Figure A illustrates the disparate rates of unemployment (on an annual basis) for Black and white workers from the late 1970s to 2021.
Black unemployment is consistently higher than unemployment of any other racial or ethnic group: Annual unemployment rate by race and ethnicity, 1979–2021
| Year | White | Black | Hispanic | Asian |
|---|---|---|---|---|
| 1979 | 5.1% | 12.3% | 8.3% | |
| 1980 | 6.3 | 14.3 | 10.1 | |
| 1981 | 6.7 | 15.6 | 10.4 | |
| 1982 | 8.6 | 18.9 | 13.8 | |
| 1983 | 8.4 | 19.5 | 13.7 | |
| 1984 | 6.5 | 15.9 | 10.7 | |
| 1985 | 6.2 | 15.1 | 10.5 | |
| 1986 | 6.0 | 14.5 | 10.6 | |
| 1987 | 5.3 | 13.0 | 8.8 | |
| 1988 | 4.7 | 11.7 | 8.2 | |
| 1989 | 4.5 | 11.4 | 8.0 | |
| 1990 | 4.8 | 11.4 | 8.2 | |
| 1991 | 6.1 | 12.5 | 10.0 | |
| 1992 | 6.6 | 14.2 | 11.6 | |
| 1993 | 6.1 | 13.0 | 10.8 | |
| 1994 | 5.3 | 11.5 | 9.9 | |
| 1995 | 4.9 | 10.4 | 9.3 | |
| 1996 | 4.7 | 10.5 | 8.9 | |
| 1997 | 4.2 | 10.0 | 7.7 | |
| 1998 | 3.9 | 8.9 | 7.2 | |
| 1999 | 3.7 | 8.0 | 6.4 | |
| 2000 | 3.5 | 7.6 | 5.7 | 3.6 |
| 2001 | 4.2 | 8.6 | 6.6 | 4.5 |
| 2002 | 5.1 | 10.2 | 7.5 | 5.9 |
| 2003 | 5.2 | 10.8 | 7.7 | 6.0 |
| 2004 | 4.8 | 10.4 | 7.0 | 4.4 |
| 2005 | 4.4 | 10.0 | 6.0 | 4.0 |
| 2006 | 4.0 | 8.9 | 5.2 | 3.0 |
| 2007 | 4.1 | 8.3 | 5.6 | 3.2 |
| 2008 | 5.2 | 10.1 | 7.6 | 4.0 |
| 2009 | 8.5 | 14.8 | 12.1 | 7.3 |
| 2010 | 8.7 | 16.0 | 12.5 | 7.5 |
| 2011 | 7.9 | 15.8 | 11.5 | 7.0 |
| 2012 | 7.2 | 13.8 | 10.3 | 5.9 |
| 2013 | 6.5 | 13.1 | 9.1 | 5.2 |
| 2014 | 5.3 | 11.3 | 7.4 | 5.0 |
| 2015 | 4.6 | 9.6 | 6.6 | 3.8 |
| 2016 | 4.3 | 8.4 | 5.8 | 3.6 |
| 2017 | 3.8 | 7.5 | 5.1 | 3.4 |
| 2018 | 3.5 | 6.5 | 4.7 | 3.0 |
| 2019 | 3.3 | 6.1 | 4.3 | 2.7 |
| 2020 | 7.3 | 11.4 | 10.4 | 8.7 |
| 2021 | 4.7 | 8.6 | 6.8 | 5.0 |

Notes: Shaded areas denote recessions. Race and ethnicity categories are not mutually exclusive; white, Black and Asian data do not exclude Hispanic workers of each race.
Source: Economic Policy Institute analysis of U.S. Bureau of Labor Statistics Current Population Survey, Annual Unemployed Rate by Race and Ethnicity data series LNU04000003, LNU04000006, LNU04000009, and LNU04032183.
Source: Economic Policy Institute analysis of U.S. Bureau of Labor Statistics Current Population Survey (Household Survey), Annual Unemployed Rate by Race and Ethnicity data series LNU04000003, LNU04000006, LNU04000009, and LNU04032183. Accessible via Series Report Data Retrieval Tool and https://download.bls.gov/pub/time.series/ln/. Accessed February 2022.
Although economic expansion—before and after the pandemic-triggered recession—resulted in historically low Black unemployment rates and narrowed the gap between Black and white workers to within 3 percentage points, rates for the two groups have never completely converged.
Racial wage gaps
Racial wage gaps have persisted from the 1960s to the present, highlighting enduring inequalities in the labor market. During the 1960s, earnings inequality narrowed rapidly, followed by an expansion starting in the mid- to late-1970s (Rodgers 2019). Despite reaching a record low in 1979, the Black-white wage gap has incrementally increased since then, as seen in Figure B. Today, the median Black-white wage gap is 23.4%—meaning a typical Black worker is paid 23.4% less per hour than a typical white worker.
The Black-white median wage gap has widened since 1979: Annual Black-white median wage gap, 1973–2021
| Date | Gap (Median) |
|---|---|
| 1973 | 22.30% |
| 1974 | 19.80% |
| 1975 | 19.10% |
| 1976 | 19.00% |
| 1977 | 18.80% |
| 1978 | 20.10% |
| 1979 | 16.40% |
| 1980 | 17.30% |
| 1981 | 17.50% |
| 1982 | 19.40% |
| 1983 | 18.30% |
| 1984 | 19.50% |
| 1985 | 19.30% |
| 1986 | 20.00% |
| 1987 | 19.60% |
| 1988 | 18.40% |
| 1989 | 20.40% |
| 1990 | 20.10% |
| 1991 | 22.10% |
| 1992 | 20.50% |
| 1993 | 19.90% |
| 1994 | 20.10% |
| 1995 | 20.80% |
| 1996 | 21.80% |
| 1997 | 21.50% |
| 1998 | 20.40% |
| 1999 | 19.60% |
| 2000 | 20.80% |
| 2001 | 22.60% |
| 2002 | 21.30% |
| 2003 | 20.20% |
| 2004 | 19.90% |
| 2005 | 21.10% |
| 2006 | 20.60% |
| 2007 | 22.30% |
| 2008 | 23.10% |
| 2009 | 21.30% |
| 2010 | 21.20% |
| 2011 | 22.20% |
| 2012 | 24.60% |
| 2013 | 22.50% |
| 2014 | 24.10% |
| 2015 | 25.60% |
| 2016 | 23.00% |
| 2017 | 25.30% |
| 2018 | 26.70% |
| 2019 | 24.40% |
| 2020 | 23.60% |
| 2021 | 23.40% |
Note: Wages are adjusted into 2021 dollars by the CPI-U-RS. The regression-based gap is based on average wages and controls for gender, race and ethnicity, education, age, and geographic division. The log of the hourly wage is the dependent variable.
Source: EPI analysis of Current Population Survey Outgoing Rotation Group microdata, https://microdata.epi.org.
Moreover, workers’ wages have failed to rise with their growth in productivity over the last 40 years, as shown in Figure C. The typical worker’s wages rose only 23.1% from 1979 to 2020—while productivity broadly increased 61.7%. The large discrepancy reflects growing wage inequality over that period, as the highest-wage workers reaped a disproportionate share of the productivity gains. For Black workers, wage gains were further limited by racial discrimination in the labor market (Moore and Banerjee 2021), leaving them further economically disadvantaged: The typical Black worker’s wage growth was only 18.9% over that period.
Workers’ wages across the board have failed to rise on pace with productivity: Productivity growth compared with typical worker wage growth and wage growth by race/ethnicity, 1979–2020
| Year | Typical worker | White workers | Black workers | Hispanic workers |
Productivity |
|---|---|---|---|---|---|
| 1979 | 0.0% | 0.0% | 0.0% | 0.0% | 0.0% |
| 1980 | -0.6% | -0.3% | -1.4% | -1.1% | -2.7% |
| 1981 | -1.7% | -2.7% | -3.9% | -5.3% | -0.9% |
| 1982 | -2.1% | -1.1% | -4.6% | -4.5% | -1.8% |
| 1983 | -1.9% | -1.9% | -4.2% | -5.4% | 1.1% |
| 1984 | -1.4% | -0.7% | -4.4% | -4.3% | 3.6% |
| 1985 | 0.1% | -1.1% | -4.5% | -4.8% | 5.2% |
| 1986 | 0.8% | 1.9% | -2.4% | -4.9% | 7.7% |
| 1987 | 1.9% | 1.6% | -2.2% | -4.9% | 7.0% |
| 1988 | 0.5% | 2.2% | -0.3% | -6.1% | 8.6% |
| 1989 | 0.3% | 1.9% | -3.0% | -7.8% | 9.4% |
| 1990 | 0.2% | 2.1% | -2.4% | -8.7% | 9.7% |
| 1991 | -0.6% | 3.6% | -3.5% | -10.0% | 10.5% |
| 1992 | 0.4% | 2.2% | -2.8% | -9.2% | 14.8% |
| 1993 | 1.9% | 0.7% | -3.5% | -10.0% | 15.3% |
| 1994 | 0.8% | -0.6% | -4.9% | -12.1% | 16.2% |
| 1995 | -0.6% | 1.1% | -4.3% | -13.3% | 16.4% |
| 1996 | -2.3% | 2.0% | -4.5% | -10.9% | 17.8% |
| 1997 | -0.3% | 3.9% | -2.4% | -11.6% | 19.6% |
| 1998 | 3.3% | 7.5% | 2.4% | -8.0% | 22.2% |
| 1999 | 5.9% | 9.2% | 5.0% | -6.7% | 24.9% |
| 2000 | 6.5% | 10.5% | 4.7% | -6.6% | 26.3% |
| 2001 | 8.1% | 13.8% | 5.3% | -2.1% | 27.7% |
| 2002 | 9.8% | 14.8% | 8.1% | -1.4% | 31.5% |
| 2003 | 9.9% | 15.6% | 10.4% | -2.7% | 35.9% |
| 2004 | 11.1% | 16.1% | 11.2% | -4.8% | 39.6% |
| 2005 | 9.5% | 13.3% | 7.0% | -4.7% | 41.8% |
| 2006 | 9.9% | 13.5% | 7.9% | -2.4% | 42.5% |
| 2007 | 10.1% | 14.0% | 6.0% | -0.5% | 43.4% |
| 2008 | 9.2% | 14.8% | 5.6% | -0.3% | 41.6% |
| 2009 | 11.6% | 16.9% | 10.0% | 0.3% | 46.8% |
| 2010 | 10.9% | 16.1% | 9.4% | -1.8% | 51.0% |
| 2011 | 8.2% | 13.8% | 6.0% | -4.3% | 49.5% |
| 2012 | 6.9% | 14.5% | 3.2% | -4.5% | 49.9% |
| 2013 | 7.4% | 13.8% | 5.5% | -4.5% | 51.0% |
| 2014 | 7.5% | 13.8% | 3.3% | -2.6% | 52.1% |
| 2015 | 9.2% | 17.0% | 4.1% | 0.2% | 54.8% |
| 2016 | 11.2% | 17.9% | 8.7% | 4.1% | 55.0% |
| 2017 | 12.1% | 19.5% | 6.8% | 8.0% | 56.2% |
| 2018 | 14.0% | 20.0% | 5.2% | 6.4% | 57.8% |
| 2019 | 15.1% | 22.1% | 10.5% | 10.4% | 59.6% |
| 2020 | 23.1% | 30.1% | 18.9% | 16.7% | 61.7% |
Note: Race and ethnicity categories are mutually exclusive (i.e., white non-Hispanic, Black non-Hispanic, and Hispanic any race).
Source: EPI analysis of unpublished Total Economy Productivity data from Bureau of Labor Statistics (BLS) Labor Productivity and Costs program, wage data from the BLS Current Employment Statistics, BLS Employment Cost Trends, BLS Consumer Price Index, and Bureau of Economic Analysis National Income and Product Accounts.
Factors influencing racial wage gaps
Racial wage gaps persist due to a combination of factors, including stagnant minimum wage, falling union coverage, and systemic factors such as occupational segregation, discrimination in hiring and pay, and inequitable pathways to promotion. This section will focus primarily on how minimum wage policies and declining rates of union coverage—two issues referenced in demands from the March on Washington and Kerner Commission recommendations—have affected the Black-white wage gap.
Minimum wage policy has impacted the Black-white wage gap in at least two distinct ways—lack of coverage for occupations disproportionately held by Black workers and failure to increase the minimum wage over time.
Under the 1966 and 1974 expansions of the Fair Labor Standards Act (FLSA), previously excluded workers in sectors such as agriculture, education, nursing homes, and restaurants saw a $1 wage floor that boosted earnings. Before this expansion, many of the workers in these sectors did not have a minimum wage. This boost particularly benefited Black workers.
The impact of these changes was significant because the newly covered sectors employed approximately one-fifth of the U.S. labor force—or nearly one-third of all Black workers. (Derenoncourt, Montialoux, and Bahn 2020). Though the 1966 amendment to the FLSA expanded the share of workers receiving the minimum wage, many Black workers were still underrepresented regarding coverage until 1974. While the FLSA expansions may have played a role in narrowing the Black-white wage gap, the economic conditions of Black workers remained less favorable than those of white workers. Particularly, stagnant federal minimum wage policies have failed to keep pace with the rising cost of living, disproportionately impacting lower-wage workers, many of whom are people of color.
Unions are critical to raising wages, combating income inequality, and reducing racial economic disparities (EPI 2021b). Concerted efforts by wealthy corporations and their allies to weaken unions have resulted in declining union membership and coverage since the late 1970s. This decline has eroded workers’ collective bargaining power and suppressed wages (Mishel and Bivens 2021). During the 1980s—the decade in which the sharpest decline in union membership occurred—anti-union sentiments were expressed at the highest level of government as the Reagan administration was known for its union-busting actions. In perhaps the most glaring example, on August 5, 1981, President Ronald Reagan fired 11,345 striking air traffic controllers, barred them from ever working for the federal government again, and decertified the Professional Air Traffic Controllers Organization union that called the strike (Schwarz 2021).
Beginning in the 1940s, Black workers have historically led white workers in union coverage—the percentage of the workforce that has joined a union or is covered by a collective bargaining unit—and received a larger than average wage boost from being covered by collective bargaining (Farber et. al. 2021). These factors helped to raise the wages of Black workers closer to those of their white counterparts. However, the sharp decline in union coverage over the last several decades has greatly narrowed the difference between Black and white workers, as shown in Figure D. This decline in union coverage has had an adverse effect on the Black-white wage gap.
Historically, Black workers have had much higher rates of union coverage than white workers—but the gap has narrowed as union coverage rates have declined: Union coverage by race, 1973–2021
| Date | White | Black | All |
|---|---|---|---|
| 2021 | 12.0% | 12.8% | 11.6% |
| 2020 | 12.3% | 13.6% | 12.1% |
| 2019 | 11.9% | 12.3% | 11.6% |
| 2018 | 12.0% | 13.4% | 11.7% |
| 2017 | 12.2% | 13.6% | 11.9% |
| 2016 | 12.2% | 14.3% | 11.9% |
| 2015 | 12.5% | 14.2% | 12.3% |
| 2014 | 12.5% | 14.3% | 12.3% |
| 2013 | 12.6% | 14.9% | 12.4% |
| 2012 | 12.7% | 14.5% | 12.5% |
| 2011 | 13.3% | 14.9% | 13.0% |
| 2010 | 13.4% | 15.0% | 13.1% |
| 2009 | 13.8% | 15.3% | 13.6% |
| 2008 | 14.0% | 15.5% | 13.7% |
| 2007 | 13.5% | 15.7% | 13.3% |
| 2006 | 13.3% | 16.0% | 13.1% |
| 2005 | 13.7% | 16.5% | 13.7% |
| 2004 | 13.9% | 16.6% | 13.8% |
| 2003 | 14.2% | 18.1% | 14.3% |
| 2002 | 14.5% | 18.8% | 14.6% |
| 2001 | 14.7% | 18.7% | 14.8% |
| 2000 | 14.7% | 18.9% | 14.8% |
| 1999 | 15.1% | 19.2% | 15.3% |
| 1998 | 15.1% | 19.7% | 15.4% |
| 1997 | 15.4% | 20.1% | 15.6% |
| 1996 | 15.8% | 21.2% | 16.2% |
| 1995 | 16.1% | 22.2% | 16.7% |
| 1994 | 16.8% | 22.9% | 17.4% |
| 1993 | 17.0% | 23.5% | 17.6% |
| 1992 | 17.0% | 23.9% | 17.8% |
| 1991 | 17.4% | 24.1% | 18.1% |
| 1990 | 17.6% | 24.1% | 18.2% |
| 1989 | 17.8% | 25.3% | 18.6% |
| 1988 | 18.1% | 25.9% | 19.0% |
| 1987 | 18.4% | 25.4% | 19.2% |
| 1986 | 19.0% | 26.6% | 19.9% |
| 1985 | 19.5% | 27.4% | 20.5% |
| 1984 | 20.5% | 29.3% | 21.6% |
| 1983 | 22.2% | 31.7% | 23.3% |
| 1982 | 22.8% | 30.7% | 23.6% |
| 1981 | 23.4% | 29.7% | 24.0% |
| 1980 | 24.6% | 33.5% | 25.7% |
| 1979 | 25.8% | 36.3% | 27.0% |
| 1978 | 24.8% | 32.9% | 25.8% |
| 1977 | 25.5% | 34.0% | 26.5% |
| 1976 | 23.8% | 32.5% | 24.7% |
| 1975 | 24.0% | 31.6% | 24.8% |
| 1974 | 25.5% | 31.1% | 26.3% |
| 1973 | 25.6% | 32.2% | 26.6% |
Notes: The union coverage rate shows the percentage of the workforce that are members of unions and/or covered by a collective bargaining agreement. Race and ethnicity categories are mutually exclusive (i.e., white non-Hispanic, Black non-Hispanic, and all others).
Source: Economic Policy Institute, “Union Coverage” (data set), State of Working America Data Library, last updated March 2023.
Attempts to build greater equity in employment
Consistently substandard labor market outcomes among Black workers demonstrate the need for federal policies that establish strong and inclusive labor standards, protect the right to a union and collective bargaining, and enforce equal employment opportunities and fair and equal pay to achieve equity and economic security. To address the civil rights era demand for “a massive federal program to train and place unemployed workers” and stronger government efforts to “ensure equal opportunity,” Congress introduced three key bills spanning several decades: the Equal Opportunity Act of 1972, the Job Training Partnership Act of 1982, and the 2014 Workforce Innovation and Opportunity Act. With the exception of the Equal Opportunity Act of 1972, these bills were largely focused on helping workers to overcome individual deficits in skills and training but failed to rectify structural and systemic inequalities that created disparate outcomes, including unequal implementation of workforce programs.
The first bill, the Equal Opportunity Act of 1972, amended Title VII of the Civil Rights Act of 1964 to address employment discrimination against Black Americans and other racial minorities. Under Title VII, the Equal Employment Opportunity Commission (EEOC) was authorized to take enforcement action against individuals, employers, and labor unions that violated the employment provisions in law. The 1972 bill expanded the authority of the EEOC to include employers with at least 15 employees instead of the previous minimum of 25 employees. While this extended civil rights protections to more workers, the EEOC has been vastly under-resourced over time, limiting the agency’s capacity to pursue valid charges or proactively challenge discriminatory practices (Yang and Liu 2021).
Subsequently, Congress passed the Job Training Partnership Act of 1982, which repealed the Comprehensive Employment and Training Act of 1973 (CETA). This bill established federal assistance programs to train youth and adults for entry into the labor force and provided job training to economically disadvantaged people and other individuals facing barriers to employment. The intention was to provide job training and other services to these groups to improve employment and earnings, increase educational and occupational skills, and decrease welfare dependency (Kirby 2004). However, unlike CETA, the Job Training Partnership Act did not include a public jobs component.
The Job Training Partnership Act authorized appropriations for fiscal year 1983 and for each succeeding fiscal year to implement adult and youth programs, federally administered programs, summer youth employment and training programs, and employment and training assistance for dislocated workers. Specifically, the $618 million bill included appropriations for any fiscal year of no more than 7% of the total amount appropriated by the bill for employment and training programs for Native Americans and migrant and seasonal farmworkers; veterans’ employment programs; the national employment and training program; a comprehensive labor market information system; the National Commission for Employment Policy; and training programs to fulfill affirmative action obligations.1 Five percent of the appropriations was designated for veterans’ employment programs, and $2 million was designated for the National Commission for Employment Policy—leaving about 2%, or about $10 million, of the appropriations to fund the rest of the measures outlined in the bill.
Unfortunately, the implementation of this bill was inefficient and discriminatory. Preliminary research by the U.S. Government Accountability Office found that (Thompson 1991):
- Racial disparities existed in training provided to Black recipients in 11–20% of the service delivery areas.
- White participants were more likely to receive classroom training and on-the-job training, while Black participants were more likely to receive only job search assistance.
- Black participants that did receive classroom training were more likely to be trained for lower-wage jobs.
Unequal program implementation renders even the most well-intentioned bill ineffective. Without proper implementation and enforcement, policies can cause further harm to communities that desperately need support.
Without proper implementation and enforcement, policies can cause further harm to communities that desperately need support.
The 2014 Workforce Innovation and Opportunity Act (WIOA) was another pivotal bill intended to strengthen federal workforce training programs. The bill replaced the Workforce Investment Act of 1998 (successor to the Job Training Partnership Act of 1982) and authorized job training and related services for unemployed or underemployed workers and established the governance and performance accountability system for the WIOA program. The bill also authorized education services to assist adults in improving their basic skills, completing secondary education, and transitioning to postsecondary education.
While the WIOA program has the potential to address crucial disadvantages for Black workers, the federal workforce system does not evenly distribute economic opportunity and exacerbates existing patterns of occupational segregation, providing only limited relief and upward mobility for Black workers during an economic downturn (Camardelle 2021). For example, data indicate that under the WIOA system, Black workers had the lowest earnings among all groups after completing federal workforce training, despite having the highest employment rate of all groups (DOL 2020).2 This is striking because Black workers use WIOA services more than most other racial groups with the exception of white workers (DOL 2021).
While post–civil rights era laws addressed some of the concerns that Black workers faced, Black Americans struggled to participate fully and equally in American society and the labor market, which is reflected in ongoing employment and wage disparities. The following sections discuss two more important themes from the March on Washington and recommendations of the Kerner Commission—access to affordable housing, and access to basic rights and freedoms.
Fair access to affordable housing
Homeownership and affordable housing have been out of reach for many Black families compared with white families due to discriminatory and racist policy (Rothstein 2017). Between 1934 and 1962, the Federal Housing Authority financed mortgages and built affordable, good quality public housing almost exclusively for white families (Schweitzer 2020). Additionally, the Servicemen’s Readjustment Act of 1944—also known as the G.I. bill—guaranteed numerous benefits for World War II veterans, including loans for veterans who borrowed money to purchase a home, business, or farm. However, most of the approximately 1.2 million Black war veterans were denied the same benefits that white veterans received (Brown 2021).
Today, the legacy of these policies and discriminatory practices like exclusionary zoning have kept Black families from achieving broad homeownership, building wealth, and accessing affordable housing (Rigsby 2016). Some of these political and economic decisions have not only affected the Black community but have also had widespread implications for overall housing costs.
One illustration of this is the implementation of exclusionary zoning, which has resulted in a shortage of housing and contributed to increased housing costs (Maye and Moore 2022). Consequently, affordable housing options have become more inaccessible for many individuals and families. This not only affects marginalized communities but also has broader implications for housing affordability and the overall housing market. As of 2019, over a quarter of homeowners with a mortgage were burdened with housing costs of more than 30% of their household income, which exceeds the affordability threshold that has become the standard for owner-occupied housing in the United States (U.S. Census Bureau ACS 2023). Without targeted, race-conscious polices to combat decades of exclusionary and discriminatory housing policies, homeownership and affordable housing will remain largely inaccessible to many Black families and others with limited income and wealth (Maye and Moore 2022).
To supplement the Fair Housing Act of 1968, Congress passed the Housing and Community Development Act of 1974 (HCDA). The HCDA amended the Housing Act of 1937 to create Section 8 housing, authorize “Entitlement Communities Grants” to be awarded by the United States Department of Housing and Urban Development, and create the National Institute of Building Sciences.
The Housing and Community Development Act was created to make grants to state and local governments to address urgent community development needs related to housing for low- and middle-income families and to prohibit discrimination based on race, color, national origin, disability, age, religion, and sex within Community Development Block Grant programs or activities.3 However, discrimination within low-income housing created from the HCDA persists, as does the broader inaccessibility of affordable housing (Demsas 2021).
Similarly, the Equal Credit Act, passed in 1974, made it unlawful for creditors to discriminate against applicants with respect to any aspect of a credit transaction on the basis of:
- race, color, religion, national origin, sex, marital status, or age (provided the applicant has the capacity to contract)
- the applicant’s use of a public assistance program to receive all or part of their income or
- the applicant’s previous good-faith exercise of any right under the Consumer Credit Protection Act
Despite the bill’s intention to expand credit access, Black applicants are consistently more likely to be denied loans than applicants from other racial groups (Passy 2022). According to the most recent Home Mortgage Disclosure Act (HMDA) data, 16.1% of all mortgage applications were denied in 2020. Black borrowers had the highest denial rate at 27.1%, while white borrowers had the lowest at 13.6% (Choi and Mattingly 2022). Other research similarly found that Black applicants are denied mortgages at a rate 84% higher than that of white applicants (Bachaud 2022).
Because of high denial rates for mortgage loans, Black families are often targeted for subprime loans and other forms of predatory lending (Badger 2013). These practices create greater barriers to Black homeownership and restrict Black families’ ability to build wealth through accumulated home equity, as seen in the low rates of homeownership for Black households relative to white households in Figure E.
Black homeownership rates grew significantly from 1940 to 1980, but started to drop after 1980: Decennial homeownership rates by race, 1900–2020
| Year | White | Black |
|---|---|---|
| 1900 | 47.9% | 22% |
| 1910 | 47 | 23.5 |
| 1920 | 47 | 22.9 |
| 1930 | 48.3 | 24.2 |
| 1940 | 43.2 | 21.1 |
| 1950 | 59.2 | 34.1 |
| 1960 | 68.8 | 40.8 |
| 1970 | 73.1 | 49.7 |
| 1980 | 76.8 | 58 |
| 1990 | 77.6 | 54.1 |
| 2000 | 74 | 47 |
| 2010 | 74 | 45 |
| 2020 | 75 | 45 |
Notes: Race and ethnicity categories are mutually exclusive (i.e., white non-Hispanic and Black non-Hispanic). Figures give the rate of owner occupancy per 100 households in our core sample. The core sample consists of households headed by males between the ages of 25 and 64, in the labor force, not enrolled in school. Observations with unreported tenure status are excluded when possible.
Sources: Collins and Margo, “Race and Home Ownership” (2011); U.S. Census Bureau. “Table 16: Quarterly Homeownership Rates by Race and Ethnicity of Householder: 1994 to Present” [Excel file], Housing Vacancies and Homeownership (CPS/HVS). Last revised September 14, 2020.
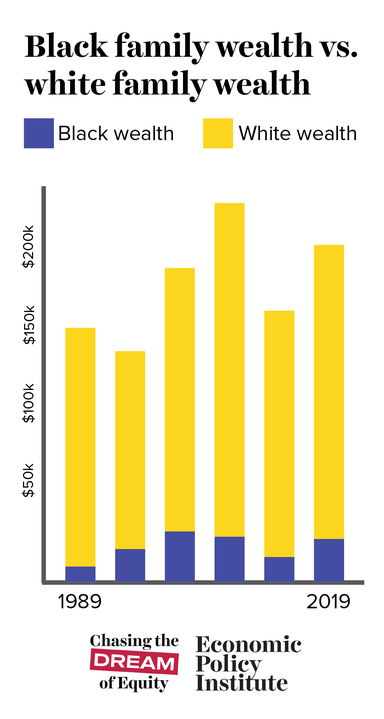
In addition to restricting Black homeownership, the legacy of exclusionary zoning and other forms of explicit housing discrimination has also curtailed the accumulation of wealth among Black families. Figure F shows the low rates of wealth for Black families compared with white families over the past three decades. While most American families’ wealth is closely tied to the value of their home, this tie is even stronger for Black and brown families. Homeownership wealth makes up a larger portion of their comparatively smaller net worth than for white families, as shown in Figure G.
The legacy of slavery, redlining, and discrimination limits Black families’ wealth compared with white families: Median family net worth by race and ethnicity, selected years from 1989 to 2019
| White | Black | |
|---|---|---|
| 1989 | $143,563 | $8,552 |
| 1992 | $124,603 | $17,698 |
| 1995 | $128,203 | $18,229 |
| 1998 | $150,957 | $24,378 |
| 2001 | $177,496 | $27,874 |
| 2004 | $191,111 | $27,656 |
| 2007 | $211,726 | $25,923 |
| 2010 | $152,878 | $18,734 |
| 2013 | $155,830 | $14,364 |
| 2016 | $181,871 | $18,240 |
| 2019 | $189,100 | $24,100 |
Note: Race and ethnicity are mutually exclusive (i.e., white non-Hispanic and Black non-Hispanic).
Source: Economic Policy Institute analysis of Federal Reserve Board, “Net Worth by Race or Ethnicity” (online table) from the Survey of Consumer Finances, 1989–2019; Last updated November 4, 2021.
American homeowners hold most of their assets in their primary residence across all racial groups—especially Black and Hispanic households: Share of total assets in primary residence by race and ethnicity, 2019
| Typical share of total assets in housing | |
|---|---|
| American households | 61% |
| White | 57% |
| Black | 74% |
| Hispanic | 80% |
| Other | 66% |
Note: Race and ethnicity are mutually exclusive (i.e., white non-Hispanic, Black non-Hispanic, and Hispanic any race).
Source: Economic Policy Institute's calculations of the Board of Governors Federal Reserve System, Consumer Finance Survey, 2019.
Basic rights and freedoms
After the civil rights era, basic rights such as the right to vote were still actively being undermined in many states. In response, communities of color looked to the federal government to strengthen and support their voting rights and protections.
The federal government’s protection of voting rights for Black Americans was initially challenged by President Reagan and then ultimately struck down by the Supreme Court. In 1982, President Reagan signed a bill to extend the Voting Rights Act of 1965 for 25 years, after a grassroots lobbying and legislative campaign forced him to abandon his plan to ease that law’s restrictions. The Voting Rights Act was amended five times after its implementation in 1970, 1975, 1982, 1992, and 2006. The extension was necessary because coverage provisions, such as the preclearance requirement of the bill in the original Voting Rights Act, were set to expire in 1970. The preclearance requirement included constraints placed on certain states and federal review of states’ voting procedures. However, by the time the extension was due, there were concerns about the continued presence of voting rights violations and discrimination. Consequently, Congress continued to amend the Act to extend the original provisions of coverage. From 2006, the protections within the Voting Rights Act remained untouched until 2013.
In 2013, the U.S. Supreme Court ruled Section 4(b) of the Voting Rights Act unconstitutional, stating that the preclearance requirement was outdated. This ruling enabled 29 states to enact restrictive voting laws, which included the closure of voting sites, the enactment of voter ID laws, and limits on early voting (Singh and Carter 2023).
Figure H shows voter registration rates for voting-age Black and white citizens in presidential election years from 1980 to 2020. Despite an increase in Black voter registration between 1980 and 1984, which surpassed 70%, it took until the 2012 election—almost 30 years—for Black voter registration to exceed its 1984 peak. These peak years in Black voter registration are also significant because they involved nationwide campaigns by Black presidential candidates—Jesse Jackson in 1984 and Barack Obama in 2012.
Historically, Black voter registration has lagged behind white voter registration: Voter registration rates for Black and white non-Hispanic citizens, presidential election years, 1980–2020
| Year | White non-Hispanic citizens | Black citizens |
|---|---|---|
| 1980 | 74.1% | 64.1% |
| 1984 | 75.1 | 72 |
| 1988 | 73.6 | 68.8 |
| 1992 | 77.1 | 70 |
| 1996 | 73 | 66.4 |
| 2000 | 71.6 | 67.5 |
| 2004 | 75.1 | 68.7 |
| 2008 | 73.5 | 69.7 |
| 2012 | 73.7 | 73.1 |
| 2016 | 73.9 | 69.4 |
| 2020 | 76.5 | 69 |
Notes: Prior to 1996, the CPS did not collect information on citizenship in a uniform way. Estimates for the citizenship population presented in this table prior to 1996 should be interpreted with caution, as they are not directly comparable to estimates from 1996 and after. Because of changes in the Current Population Survey race categories beginning in 2003, 2004–2020 data on race are not directly comparable with data from earlier years. This table shows data for people who reported they were single race white and not Hispanic and people who reported single race Black. Use of single race populations does not imply that it is the preferred method of presenting or analyzing data. For information on confidentiality protection, sampling error, non-sampling error, and definitions, see Complete Technical Documentation for the Current Population Survey.
Prior to 1972, data are for people ages 21–24 with the exception of those ages 18–24 in Georgia and Kentucky, 19–24 in Alaska, and 20–24 in Hawaii. In 1972, with the passage of the Twenty-Sixth Amendment, the minimum voting age was reduced from 21 to 18 for all states. Prior to 1996, the CPS did not collect information on citizenship in a uniform way. Estimates for the citizenship population presented in this table prior to 1996 should be interpreted with caution, as they are not directly comparable to estimates from 1996 and after. Because of changes in the Current Population Survey race categories beginning in 2003, 2004–2020 data on race are not directly comparable with data from earlier years. Federal surveys now give respondents the option of reporting more than one race. Therefore, two basic ways of defining a race group are possible. A group such as Asian may be defined as those who reported Asian and no other race (the race-alone or single-race concept) or as those who reported Asian regardless of whether they also reported another race (the race-alone-or-in-combination concept). This table shows data for people who reported they were single race white and not Hispanic and people who reported single race Black. Use of single-race populations does not imply that it is the preferred method of presenting or analyzing data. For information on confidentiality protection, sampling error, nonsampling error, and definitions, see Complete Technical Documentation for the Current Population Survey.
Source: U.S. Census Bureau, "Table A-1. Reported Voting and Registration by Race, Hispanic Origin, Sex and Age Groups: November 1964 to 2022" [Excel file].
Black voters have historically had lower voter turnout than white voters. Little progress has been made in mitigating the volatility and persistence of these disparities as state efforts to suppress voter turnout and gerrymander districts have only increased (Timm 2021). But, as seen in Figure I, the white-Black voter turnout gap—the percentage of registered white voters who voted minus the percentage of registered Black voters who voted—hit historic lows during the 2008 and 2012 presidential elections. Similar to the peak years for Black voter registration, 2008 and 2012 involved the historic election and reelection of the nation’s first Black president, Barack Obama. Black voter turnout exceeded white voter turnout in 2012. However, following those two election cycles, the gap widened again—rising to 8.3 percentage points in 2020.
White voters have historically had larger voter turnout rates than Black voters: White-Black voter turnout gap, presidential and midterm election years, 1980–2020
| Year | White/non-Hispanic – Black Gap |
|---|---|
| 1980 | 12.3 |
| 1982 | 7.9 |
| 1984 | 5.8 |
| 1986 | 5.2 |
| 1988 | 9.2 |
| 1990 | 8.9 |
| 1992 | 11.0 |
| 1994 | 12.1 |
| 1996 | 7.7 |
| 1998 | 5.6 |
| 2000 | 5.0 |
| 2002 | 6.8 |
| 2004 | 7.2 |
| 2006 | 10.6 |
| 2008 | 1.4 |
| 2010 | 5.1 |
| 2012 | -2.1 |
| 2014 | 6.1 |
| 2016 | 5.9 |
| 2018 | 6.4 |
| 2020 | 8.3 |
Notes: Race and ethnicity are mutually exclusive (i.e., white non-Hispanic, Black non-Hispanic, and Hispanic any race). The voter turnout gap is the difference between the registration rates and voter turnout rates of white non-Hispanic citizens and Black citizens. Black is a single race category and does not distinguish Hispanic ethnicity from non-Hispanic ethnicity. The white voter turnout rate is of non-Hispanic white citizens.
Source: U.S. Census Bureau, Current Population Survey, November 1964–2020.
These findings suggest that in addition to protecting the basic right to vote, the political engagement of Black voters is also motivated by a sense that there are candidates who represent them and their issues. Thus, reducing systemic barriers people of color face in running for office is also key for a strong and equitable democracy.
Although voting rights protections were extended under the Reagan administration, President Reagan’s fervent campaign to maintain “law and order” and triumph in his so-called war on drugs threatened the lives and well-being of Black families. Under this premise, the Reagan administration directly targeted Black families with new policies criminalizing the socioeconomic challenges experienced by Black Americans and increasing enforcement actions in communities of color.
In addition to criminalizing drug users in a “war on drugs,” the Reagan administration campaigned against families who received welfare and government support and made significant cuts to federal safety net programs like Medicaid, food stamps, and federal education programs—all of which greatly impacted economically vulnerable communities of color (Potter 2021). Many of Reagan’s policies have been linked to the exacerbation of social and economic inequities, including wealth and income inequality and the rising trend in mass incarceration (Srikanth 2020).
In 1984, the Reagan administration passed the Comprehensive Crime Control Act. This bill increased federal penalties for the cultivation, possession, and transfer of marijuana and abolished parole for federal prisoners convicted after November 1, 1987. Shortly after, the Reagan administration enacted the Anti-Drug Abuse Acts of 1986 and 1988. These laws transformed the system of federal supervised release from a rehabilitative system to a punitive one. The 1986 Act legalized new mandatory minimum sentences for drugs, including marijuana, while the 1988 Act created the policy goal of a drug-free America, established the Office of National Drug Control Policy, and restored the federal government’s use of the death penalty. The 1988 Act also included amendments to make crack cocaine the only drug with a mandatory minimum penalty for a first offense of simple possession—a drug that, at the time, had largely affected communities of color.
Ultimately, the Reagan administration’s criminalization of drug use and addiction resulted in the incarceration of a substantial number of Black Americans. Between 1980 and 1993, the percentage of sentenced inmates who were Black grew from 46.5% to 50.8% (Stanglin 2020). Increased criminalization of Black Americans limited the social and economic outcomes of Black families, often with disastrous consequences for entire communities and across multiple generations.
This trend toward increasingly punitive policies continued into the Clinton administration. In 1994, President Clinton signed the Violent Crime Control and Law Enforcement Act. This law—commonly referred to as the 1994 Crime Bill—is the largest crime bill in U.S. legislative history. The act expanded federal crime law in several ways: It implemented a federal death penalty, eliminated higher education for inmates, invested $9.7 billion in funding for prisons, and authorized the Community Oriented Policing Services to hire 100,000 police officers. The bill aligns with the theme of many post–civil rights era policies by criminalizing the symptoms of poverty without alleviating the associated levels of inequality and hardship.
The investment in law-and-order policies in the 1980s and 1990s is directly linked to the rise in incarceration rates in those decades. As shown in Figure J, incarceration rates began to rise significantly in state prisons starting in the mid-1970s. Local jail incarceration rates also began to rise in the early 1980s. Federal incarceration rates gradually began to increase from the mid-1980s to about 2012. With the cumulative effects of the 1994 Crime Bill and the Reagan administration’s Comprehensive Crime Control Act and Anti-Drug Abuse Acts of 1988 and 1989, incarceration rates for federal, state, and local prisons more than tripled between the mid-1970s and early 2000s.
Federal, state, and local incarceration rates rose significantly throughout the 1980s and 1990s: Federal, state, and local incarceration rates per 100,000 population, 1925–2020
| Year | State prisons | Federal prisons | Local jails |
|---|---|---|---|
| 1925 | 73 | 6 | |
| 1926 | 77 | 6 | |
| 1927 | 85 | 6 | |
| 1928 | 89 | 7 | |
| 1929 | 88 | 11 | |
| 1930 | 95 | 10 | |
| 1931 | 100 | 10 | |
| 1932 | 100 | 10 | |
| 1933 | 100 | 9 | |
| 1934 | 100 | 10 | |
| 1935 | 101 | 12 | |
| 1936 | 101 | 12 | |
| 1937 | 106 | 12 | |
| 1938 | 110 | 13 | |
| 1939 | 122 | 15 | |
| 1940 | 116 | 15 | 75 |
| 1941 | 110 | 14 | |
| 1942 | 98 | 12 | |
| 1943 | 88 | 12 | |
| 1944 | 82 | 13 | |
| 1945 | 82 | 13 | |
| 1946 | 86 | 12 | |
| 1947 | 92 | 12 | |
| 1948 | 94 | 11 | |
| 1949 | 97 | 11 | |
| 1950 | 97 | 11 | 57 |
| 1951 | 95 | 11 | |
| 1952 | 95 | 11 | |
| 1953 | 95 | 12 | |
| 1954 | 99 | 12 | |
| 1955 | 99 | 12 | |
| 1956 | 99 | 12 | |
| 1957 | 101 | 12 | |
| 1958 | 104 | 12 | |
| 1959 | 104 | 13 | |
| 1960 | 104 | 13 | 67 |
| 1961 | 106 | 13 | |
| 1962 | 104 | 13 | |
| 1963 | 102 | 12 | |
| 1964 | 100 | 11 | |
| 1965 | 97 | 11 | |
| 1966 | 91 | 10 | |
| 1967 | 88 | 10 | |
| 1968 | 83 | 10 | |
| 1969 | 87 | 10 | |
| 1970 | 85 | 10 | 79 |
| 1971 | 85 | 10 | |
| 1972 | 83 | 10 | |
| 1973 | 85 | 11 | |
| 1974 | 91 | 10 | |
| 1975 | 100 | 11 | |
| 1976 | 108 | 12 | |
| 1977 | 112 | 13 | |
| 1978 | 119 | 12 | 76 |
| 1979 | 123 | 10 | |
| 1980 | 129 | 9 | 72 |
| 1981 | 144 | 10 | |
| 1982 | 160 | 10 | |
| 1983 | 167 | 11 | 98 |
| 1984 | 175 | 12 | 99 |
| 1985 | 187 | 14 | 108 |
| 1986 | 201 | 15 | 114 |
| 1987 | 214 | 16 | 122 |
| 1988 | 228 | 17 | 141 |
| 1989 | 255 | 19 | 160 |
| 1990 | 275 | 20 | 163 |
| 1991 | 289 | 22 | 169 |
| 1992 | 304 | 26 | 174 |
| 1993 | 331 | 29 | 178 |
| 1994 | 358 | 31 | 187 |
| 1995 | 379 | 32 | 193 |
| 1996 | 393 | 33 | 196 |
| 1997 | 409 | 35 | 212 |
| 1998 | 424 | 38 | 219 |
| 1999 | 434 | 42 | 222 |
| 2000 | 426 | 44 | 220 |
| 2001 | 422 | 48 | 222 |
| 2002 | 428 | 49 | 231 |
| 2003 | 431 | 52 | 238 |
| 2004 | 433 | 54 | 243 |
| 2005 | 436 | 56 | 253 |
| 2006 | 443 | 58 | 256 |
| 2007 | 447 | 59 | 259 |
| 2008 | 447 | 60 | 258 |
| 2009 | 443 | 61 | 250 |
| 2010 | 439 | 61 | 242 |
| 2011 | 429 | 63 | 236 |
| 2012 | 417 | 62 | 237 |
| 2013 | 416 | 61 | 231 |
| 2014 | 411 | 60 | 234 |
| 2015 | 403 | 55 | 227 |
| 2016 | 397 | 53 | 229 |
| 2017 | 390 | 51 | 229 |
| 2018 | 382 | 50 | 226 |
| 2019 | 371 | 48 | 224 |
| 2020 | 315 | 43 | 167 |
Source: Calculated from the counts found in Bureau of Justice Statistics data and the U.S. Census Bureau population counts made available at www.prisonpolicy.org/data/us_population_by_sex_over_time.xlsx.
Beginning in 2009, federal, state, and local incarceration rates began to decline steadily. While the racial disparity in incarceration rates also declined over that time, a significant gap still persists. As seen in Figure K, the Black incarceration rate was approximately 6.3 times as high as the white incarceration rate in 2009. By 2019, the Black incarceration rate had dropped by nearly 30% (from 1,544 to 1,096 per 100,000 residents) but was still 5.1 times as high as the white incarceration rate. The crime reform bills of the 1980s and 1990s continue to play a significant role in weaponizing the justice system against marginalized communities and reinforcing patterns of economic vulnerability.
While the Black imprisonment rate has decreased, Black people are still five times as likely as white people to be imprisoned: Imprisonment rates per 100,000 U.S. residents by race and ethnicity, 2009–2019
| Year | White | Black | Hispanic |
|---|---|---|---|
| 2009 | 245 | 1544 | 694 |
| 2010 | 245 | 1500 | 672 |
| 2011 | 240 | 1447 | 660 |
| 2012 | 236 | 1383 | 636 |
| 2013 | 236 | 1354 | 626 |
| 2014 | 233 | 1305 | 605 |
| 2015 | 228 | 1247 | 586 |
| 2016 | 223 | 1206 | 585 |
| 2017 | 221 | 1169 | 569 |
| 2018 | 218 | 1134 | 549 |
| 2019 | 214 | 1096 | 525 |
Note: Race and ethnicity categories are mutually exclusive (i.e., white non-Hispanic, Black non-Hispanic, and Hispanic any race).
Source: Economic Policy Institute analysis of Bureau of Justice Statistics Federal Justice Statistics, 2019, Table 6.
Economic Policy Institute analysis of U.S Department of Justice, Bureau of Justice Statistics, “Table 6. Imprisonment Rates of U.S. Adults, Based on Sentenced Prisoners under the Jurisdiction of State or Federal Correctional Authorities, By Jurisdiction, Sex, Race or Ethnicity, 2009–2019” (downloadable data table) from Federal Justice Statistics, 2019, October 2021.
Going forward: Policy recommendations
Although six decades have passed, the demands presented during the March on Washington still serve as the bedrock for addressing structural racism and improving social and economic outcomes for Black Americans. Many of the pressing issues that motivated the March on Washington have yet to be resolved. Most policies enacted since then have offered race-neutral solutions that cannot tackle the enormity of structural racism. Policymakers need both targeted and race-conscious policies to address the root issue of racism within U.S. institutions, make scalable investments in eliminating racial inequality, and achieve genuine racial equity.
Lessons from the Great Recession and the pandemic recession
Over the past 15 years—from the Great Recession to the ongoing COVID-19 pandemic—most workers have faced great economic instability from the shockwaves created by global financial and public health crises. In both instances, legislators were galvanized into acting fast to save the economy. Policymakers tried to keep the U.S. economy afloat through a broad infusion of federal spending, including a combination of direct stimulative investments, fiscal support for states and localities, tax expenditures, and enhancements to federal programs that provide critical support to families. However, the scale of federal interventions relative to the scope of the problem during the Great Recession and COVID-19 recession were dramatically different. Consequently, the measurable economic impact of those interventions also differed.
The American Recovery and Reinvestment Act of 2009 (ARRA), passed in response to the Great Recession, had a total cost of approximately $831 billion between 2009 and 2019, making it one of the largest stimulus packages in U.S. history at the time (CBO 2012). During the worst years of the COVID-19 pandemic, two key bills, totaling about $4 trillion, were passed: the Coronavirus Aid, Relief, and Economic Security (CARES) Act of 2020 and the American Rescue Plan Act of 2021.
The more recent bills directed much-needed investment in health care, education, infrastructure, and financial support to workers. The CARES Act was the largest economic stimulus package in U.S. history. Along with the American Rescue Plan Act, the CARES Act provided critical relief to workers and their families in the form of economic impact (stimulus) payments, an expanded Child Tax Credit, expanded eligibility and enhancements for unemployment insurance, and food and housing assistance. By providing critical support to those who were struggling to get by in the wake of the pandemic recession, these programs kept millions of people out of poverty, with a particularly large impact on Black and Hispanic households (Banerjee and Zipperer 2021, 2022; Wilson and Maye 2022).
These measures also fueled a rapid jobs recovery. Private sector employment recovered in 27 months, compared with 76 months following the Great Recession. The recent jobs recovery reduced the Black unemployment rate to historic lows (EPI 2023a). Further, the tightening labor market helped to support stronger wage growth among low-wage workers who are disproportionately Black and Hispanic (Gould and deCourcy 2023).
These policies were passed out of necessity to address the state of the economy and combat a global crisis. Their success highlights that, if motivated to do so, federal policymakers could authorize an appropriate level of investment to oppose the lingering economic effects of what is America’s oldest crisis—structural racism.
Policy proposals to advance racial equity
To achieve racial equity and justice, policymakers must fix the policy failures that have perpetuated systemic disparities and identify policy measures that meet the size and specificity of these problems. Using the demands from the March on Washington as a framework, this report will outline policy recommendations in three key areas: fair pay and equal employment, fair access to housing and wealth, and other essential rights and freedoms. By addressing these fundamental pillars, policymakers can tackle the main barriers preventing Black Americans from fully participating in the economy and society.
Fair pay and equal employment
The demands issued during the March on Washington show the interconnectedness of labor and civil rights: Policies to advance racial equity must address fair and adequate pay and equal opportunities. Legislation like raising the minimum wage to at least $17 an hour and protecting workers’ right to unionize will boost the economic security of Black workers. In order to accomplish these goals, fiscal and monetary policy need to work in tandem so that the benefits gained by the Federal Reserve’s actions to maximize employment are supported and sustained by legislation.
One of the primary demands of the March on Washington was a national minimum wage that provided an adequate standard of living. March organizers indicated that anything less than $2 an hour—$19.53 in 2023 dollars—would be insufficient. Today, the federal minimum wage has remained stalled at $7.25 since 2009. Black workers are more likely to be employed in jobs paying the minimum wage and less likely to work in states or localities that have passed a state minimum wage that is higher than the federal minimum wage (EPI 2019; Wilson 2019). Raising the minimum wage to at least $17 an hour would greatly benefit Black workers and their families. The Raise the Wage Act of 2023 would achieve this.
Similarly, the Protecting the Right to Organize (PRO) Act would also benefit Black workers by making it easier for workers who want union representation to organize. Today, Black workers are the most highly unionized racial/ethnic group in the labor force. The PRO Act would bolster the National Labor Relations Act with new provisions that would prevent employers from exploiting legal loopholes to suppress and impede negotiations with their workers. These protections are critical for Black workers to build power in their workplaces and safeguard their labor rights (Economic Policy 2021a).
Fiscal policy measures like those mentioned above work in tandem with monetary policy decisions, which can affect wage growth and unemployment levels. The Federal Reserve’s monetary policy decisions play a major role in determining how much wage growth Black workers experience and how high or low unemployment levels go. Recent revisions to the central bank’s long-run goals and policy strategy have demonstrated the impact monetary policy can have on racial economic inequality. For example, Fed monetary policy decisions to keep interest rates low for an extended period during the long recovery from the Great Recession helped to bring the monthly Black unemployment rate down below 6% for the first time in the months before the COVID-19 pandemic (Bernstein and Jones 2020; Bivens 2021).
Fair access to housing and wealth
For decades, the racist practice of redlining—rejecting applicants who want to purchase homes in neighborhoods deemed “riskier” for lenders and related forms of discrimination—played a significant role in systematically denying Black families the opportunity to build wealth through homeownership. Redlining perpetuated racial segregation and stifled economic mobility for marginalized communities by means of discriminatory lending and housing policies. This historical legacy continues to cast a long shadow, contributing to persistent wealth disparities between Black Americans and other Americans.
Experts on the history of the racial wealth gap argue that slavery, Jim Crow laws, and the enduring patterns of discrimination, call for nothing less than a direct federal reparations program for descendants of enslaved people to close the gap (Darity and Mullen 2020; Darity, Mullen, and Hubbard 2023). Other strategies to advance racial equity in asset distribution, including policy initiatives like baby bonds and the expansion of federal housing programs, can also be instrumental in narrowing the wealth gap and promoting economic inclusivity.4 By acknowledging the historical injustices and systemic discrimination Black communities have faced, reparations can serve as a targeted mechanism for redressing the accumulated economic harm. A reparations program would not only acknowledge the past—it would also provide a tangible path toward greater equity and justice in asset ownership.
Additionally, the correction of inequities in home appraisals through policy solutions is of utmost importance, particularly for Black homeowners. Home appraisals are intended to provide an impartial and fair evaluation of a property’s market value during the homebuying and lending process. This assessment allows lenders to make informed decisions about the property’s risk. However, the presence of bias in home valuations, specifically affecting Black and brown households, creates a significant hurdle for these families, depriving them of the full financial advantages that come with homeownership and further widening the existing racial wealth disparity.
To tackle this issue, the Biden administration established the Interagency Task Force on Property Appraisal and Valuation Equity (PAVE), aimed at developing transformative measures to eradicate racial and ethnic bias in home valuations. The proposed actions include enhancing oversight and accountability within the appraisal industry, preventing algorithmic bias in home evaluations, and harnessing federal data and expertise to inform policy, practices, and research related to appraisal bias.
By implementing the policy recommendations outlined in the Action Plan, PAVE strives to foster equitable homeownership opportunities for all Americans, bridging the racial wealth gap and promoting financial stability for Black and brown households.
The Homes for All Act addresses the civil rights era demand for fair and affordable housing.5 By allocating over $800 billion over a decade to construct more than 12 million affordable housing units, this comprehensive legislation can pave the way for tangible progress. The bill’s provision to build over 8.5 million public housing units would provide accessible and good quality housing options for low-income and marginalized communities. Also, the bill’s provision to invest $200 million in the Housing Trust Fund would support the development of 3.5 million new private affordable housing projects for low- and extremely low-income families. By expanding affordable housing options and promoting homeownership opportunities, the Homes for All Act can foster equitable homeownership opportunities and economic stability among low- and moderate-income Black American households in particular. Making the dream of homeownership accessible to more families incorporates housing equity in a broader strategy to address racial wealth disparities.
Basic rights and freedoms
Essential rights and freedoms include access to voting and freedom from overpolicing. Despite the protections established during the civil rights era, voting rights for Black Americans face relentless attacks in many states. Gerrymandering, voter ID laws, voter roll purges, and other suppression tactics disproportionately impact minority communities and hinder their access to the ballot box (American Civil Liberties Union 2021). The John Lewis Voting Rights Advancement Act is a critical policy to safeguard the fundamental rights and freedoms of Black Americans. By restoring voting rights protections that have been eroded, this legislation would empower the Department of Justice (DOJ) to monitor and review changes to voting laws in jurisdictions with a history of racial discrimination.6 Under the proposed preclearance process, these jurisdictions would be required to seek permission from DOJ before making any alterations to their voting rules. This proactive approach is vital to ensuring equal access to the ballot box and protecting against potential voter suppression tactics that disproportionately affect marginalized communities.
Further, excessive policing and surveillance infringe on the basic rights and freedoms of Black Americans. Racial profiling, excessive use of force, and biased surveillance practices disproportionately harm Black communities, eroding their sense of safety, dignity, and fair treatment. The overpolicing and surveillance of Black Americans have perpetuated a cycle of distrust, fear, and systemic injustice that restricts their ability to freely exercise their rights.
Policymakers should direct more public resources toward mental health services, explore community-engaged approaches to public safety, and reduce penalties for minor non-violent offenses. Prioritizing mental health services would be an acknowledgment that few members of law enforcement are professionally equipped to handle public health issues. Community-engaged approaches to public safety would acknowledge the systemic issues surrounding overpolicing and its disproportionate effect on Black Americans that have fostered adversarial relationships with traditional policing in communities of color. Decriminalizing minor offenses can also help blunt the adverse consequences of biased law enforcement practices.
These policy recommendations collectively reflect a comprehensive approach to safeguarding the basic rights and freedoms of Black Americans.
Conclusion
In the decades that followed the civil rights era, policymakers struggled to uphold the principles of equality, equity, and freedom in practice. Despite the enactment of some well- meaning policies, the legislation passed over several decades has largely failed to address major inequities. Policymakers have created incremental additions to civil rights legislation and anti-discriminatory laws, enacted potentially meaningful programs that were inadequately funded or enforced, or deliberately undermined civil rights era laws to maintain racial economic disparities.
The cyclical consequences of these policies have caused generational harm apparent in the persistent racial disparities in economic and social outcomes presented in this report. The government’s failure to enact bold policies has permitted stubborn vestiges of white supremacy to linger and undermined American ideals of equality, opportunity, and prosperity for all.
Today, Black workers continue to fight for economic and racial justice in the workplace, labor market, and society. While incremental progress has been made, it is insufficient when racial justice is the goal.
Policymakers must recognize the failure of past policies to achieve the desired outcome of addressing systemic racism. They must acknowledge the insufficient strides taken to reverse inequity. And they must count the moral and economic cost of structural racism. Without comprehensive, race-conscious policies, lawmakers will continue to repeat the mistakes of former administrations and perpetuate inequality.
Notes
1. Job Training Partnership Act, H.R. 5320, 97th Cong. (1982).
2. The employment rate for Black WIOA participants in the second quarter after exit was 73.8%. The employment rates for the same period were 73.5% for Hispanic workers, 71.1% for white workers, and 69.1% for “Other” workers.
3. Housing and Community Development Act of 1974, S.3066, 93rd Cong. (1974). U.S. Department of Housing and Urban Development, Section 109 of the Housing and Community Development (HCD) Act of 1974 (web page), accessed on February 15, 2023.
4. The Baby Bonds policy, as proposed in Cory Booker’s Opportunity Accounts program, aims to establish individual accounts for every child in the United States. These accounts would be initiated with an initial deposit ranging from $1,000 to $3,000, with the amount varying based on the child’s family income. Each year, additional contributions would be made to these accounts based on the family’s income, continuing until the child reaches 18 years of age. At that point, the funds in the accounts could be utilized for specific purposes, such as education, homeownership, or retirement.
5. Homes for All Act of 2021, H.R. 7191, 117th Cong. (2021).
6. John R. Lewis Voting Rights Advancement Act of 2021, H.R.4, 117th Cong. (2021).
References
American Civil Liberties Union. 2021. “Block the Vote: How Politicians Are Trying to Block Voters from the Ballot Box.” American Civil Liberties Union website, August 18, 2021.
Austin, Algernon, Thomas J. Sugrue, Sylvia Allegretto, Steven Pitts, Richard Rothstein, Barbara Arnwine, William Spriggs, Alton Hornsby, Jr., and Robynn J.A. Cox. 2013. The Unfinished March. Economic Policy Institute, June 2013.
Bachaud, Nicole. 2022. “Black Mortgage Applicants Denied 84% More Often Than White Borrowers.” Zillow, January 13, 2022.
Badger, Emily. 2013. “The Dramatic Racial Bias of Subprime Lending During the Housing Boom.” Bloomberg, August 16, 2013.
Banerjee, Asha, and Ben Zipperer. 2021. “Social Insurance Programs Cushioned the Blow of the COVID-19 Pandemic in 2020.” Working Economics Blog (Economic Policy Institute), September 14, 2021.
Banerjee, Asha, and Ben Zipperer. 2022. “Pandemic Safety Net Programs Kept Millions out of Poverty in 2021, New Census Data Show.” Working Economics Blog (Economic Policy Institute), September 13, 2022.
Bernstein, Jared, and Janelle Jones. 2020. The Impact of the COVID19 Recession on the Jobs and Incomes of Persons of Color. Center on Budget and Policy Priorities, June 2, 2020.
Bivens, Josh. 2021. The Promise and Limits of High-Pressure Labor Markets for Narrowing Racial Gaps. Economic Policy Institute, August 2021.
Britannica. 2023. “The Riots of the Long, Hot Summer.” Britannica website. Accessed February 15, 2023.
Brown, Hayes. 2021. “Black Veterans Were Denied GI Bill Benefits After WWII. It’s Time to Fix That.” MSNBC, November 11, 2021.
Bureau of Labor Statistics (BLS). 2022a. “Unemployment Rate – Black or African American [LNS14000006].” Retrieved from FRED, Federal Reserve Bank of St. Louis, March 7, 2022.
Bureau of Labor Statistics (BLS). 2022b. “Unemployment Rate – White [LNS14000003].” Retrieved from FRED, Federal Reserve Bank of St. Louis, March 7, 2022.
Camardelle, Alex. 2021. Principles to Support Black Workers in the Workforce Innovation and Opportunity Act. Joint Center for Political and Economic Studies, October 2021.
Choi, Jung Hyun, and Peter J. Mattingly. 2022. “What Different Denial Rates Can Tell Us About Racial Disparities in the Mortgage Market.” Urban Wire, Urban Institute, January 13, 2022.
Collins, William J., and Robert A. Margo. 2011. “Race and Home Ownership from the Civil War to the Present.” National Bureau of Economic Research Working Paper no. 16665, January 2011.
Congressional Budget Office (CBO). 2012. Estimated Impact of the American Recovery and Reinvestment Act on Employment and Economic Output from October 2011 through December 2011. Publication no. 4435, February 2012.
Darity, William A., and A. Kirsten Mullen. 2020. From Here to Equality: Reparations for Black Americans in the Twenty-First Century. Chapel Hill, N.C.: Univ. of North Carolina Press.
Darity, William A., A. Kirsten Mullen, and Lucas Hubbard, eds. 2023. The Black Reparations Project: A Handbook for Racial Justice. Berkeley, Calif.: Univ. of California Press.
Demsas, Jerusalem. 2021. “‘Housing Discrimination Is Alive and Well’: Watchdog Group Sues 36 Realtors and Landlords in New York.” Vox, June 30, 2021.
Department of Labor (DOL). 2020. “Table II-28. Outcomes of Adults, by Ethnicity and Race.” In PY 2019 Data Book: WIOA and Wagner-Peyser. Office of Policy Development and Research, Employment and Training Administration, December 2020.
Department of Labor (DOL). 2021. “Program Year 2019 Workforce Performance Results.”
Derenoncourt, Ellora, Claire Montialoux, and Kate Bahn. 2020. Why Minimum Wages Are a Critical Tool for Achieving Racial Justice in the U.S. Labor Market. Washington Center for Equitable Growth, October 29, 2020.
Economic Policy Institute (EPI). 2021a. How the PRO Act Restores Workers’ Right to Unionize (fact sheet). February 4, 2021.
Economic Policy Institute (EPI). 2021b. Unions Help Reduce Disparities and Strengthen Our Democracy (fact sheet). April 23, 2021.
Economic Policy Institute (EPI). 2023a. Jobs and Unemployment (economic indicators). Accessed June 7, 2023.
Economic Policy Institute (EPI). 2023b. “Union Coverage” (data set). State of Working America Data Library. Last updated March 2023.
Farber, Henry, Daniel Herbst, Ilyana Kuziemko, and Suresh Naidu. 2021. “Unions and Inequality over the 20th Century: New Evidence from Survey Data.” Quarterly Journal of Economics 136, no. 3: 1325–1385. https://doi.org/10.1093/qje/qjab012.
Gould, Elise, and Katherine deCourcy. 2023. Low-Wage Workers Have Seen Historically Fast Real Wage Growth in the Pandemic Business Cycle. Economic Policy Institute, March 23, 2023.
Gould, Elise, and Valerie Wilson. 2020. Black Workers Face Two of the Most Lethal Preexisting Conditions for Coronavirus—Racism and Economic Inequality. Economic Policy Institute, June 2020.
Haas Institute for a Fair and Inclusive Society (Haas). 2018. “Key Kerner Commission Recommendations.” Compiled for the “Race & Inequality in America: The Kerner Commission at 50” conference. Othering & Belonging Institute website, accessed February 15, 2023.
Haberman, Clyde. 2020. “The 1968 Kerner Commission Report Still Echoes Across America.” New York Times, June 23, 2020.
King Institute. 2023. “March on Washington for Jobs and Freedom.” Martin Luther King, Jr. Encyclopedia, Stanford University website. Accessed February 15, 2023.
Kirby, Sheila Nataraj. 2004. “The Job Training Partnership Act and the Workforce Investment Act.” In Organizational Improvement and Accountability: Lessons for Education from Other Sectors, edited by Sheila Nataraj Kirby and Brian Stecher, 1st ed., 51–64. RAND Corporation, 2004.
Library of Congress (LOC). 2023. “The African American Odyssey: A Quest for Full Citizenship.” Library of Congress website. Accessed February 15, 2023.
Maye, Adewale A., and Kyle K. Moore. 2022. “The Growing Housing Supply Shortage Has Created a Housing Affordability Crisis.” Working Economics Blog (Economic Policy Institute), July 14, 2022.
Mishel, Lawrence, and Josh Bivens. 2021. Identifying the Policy Levers Generating Wage Suppression and Wage Inequality. Economic Policy Institute, May 2021.
Moore, Kyle K., and Asha Banerjee. 2021. “Black and Brown Workers Saw the Weakest Wage Gains over a 40-Year Period in Which Employers Failed to Increase Wages with Productivity.” Working Economics Blog (Economic Policy Institute), September 16, 2021.
National Constitution Center. 2023. “Plessy v. Ferguson (1896).” National Constitution Center website. Accessed July 5, 2023.
Passy, Jacob. 2022. “‘The Gap in Credit Access Is Growing Along Racial Lines’: Black Applicants Are Denied a Mortgage 84% More Often Than White Peers.” MarketWatch, January 13, 2022.
Potter, Claire Bond. 2021. “The Shadow of Ronald Reagan Is Costing Us Dearly.” New York Times, November 11, 2021.
Rigsby, Elliot Anne. 2016. “Understanding Exclusionary Zoning and Its Impact on Concentrated Poverty.” The Century Foundation website, June 23, 2016.
Robinson, Cleveland, and Bayard Rustin. 1963. Organizing Manual No. 2: Final Plans for the March on Washington for Jobs and Freedom. Accessed February 15, 2023, at the Civil Rights Movement Archive, crmvet.org.
Rodgers, Harrell R., and Charles S. Bullock III. 1974. “Political and Racial Attitudes: Black Versus White.” Journal of Black Studies 4, no. 4 (June): 463–485.
Rothstein, Richard. 2017. The Color of Law: A Forgotten History of How Our Government Segregated America. New York, NY: Liveright Publishing Corporation.
Rothwell, Jonathan, and Andre M. Perry. 2022. How Racial Bias in Appraisals Affects the Devaluation of Homes in Majority-Black Neighborhoods. Brookings Institute, December 5, 2022.
Schwarz, Jon. 2021. “The Murder of the U.S. Middle Class Began 40 Years Ago This Week.” The Intercept, August 6, 2021.
Schweitzer, Ally. 2020. “For Many Black Washingtonians, Homeownership Remains Out of Reach.” WAMU 88.5, February 11, 2020.
Singh, Jasleen, and Sara Carter. 2023. “States Have Added Nearly 100 Restrictive Laws Since SCOTUS Gutted the Voting Rights Act 10 Years Ago.” Brennan Center for Justice, June 23, 2023.
Srikanth, Anagha. 2020. “Huge New Study Shows Trickle-Down Economics Makes Inequality Worse, Researchers Say.” The Hill, December 17, 2020.
Stanglin, Doug. 2020. “Fact Check: 1994 Crime Bill Did Not Bring Mass Incarceration of Black Americans.” USA Today, July 3, 2020.
Thompson, Lawrence H. 1991. “Job Training Partnership Act: Racial and Gender Disparities in Services.” Testimony before the House Committee on Government Operations, Subcommittee on Employment and Housing, Washington, D.C., July 17, 1991.
Timm, Jane C. 2021. “19 States Enacted Voting Restrictions in 2021.” NBC, December 21, 2021.
U.S. Census Bureau, American Community Survey (U.S. Census Bureau ACS). 2023. Public data series accessed via ACS website “American Community Survey Data” tab and the Selected Housing Characteristics data tool. Accessed February 15, 2023.
Westcott, Diane Nilsen. 1982. “Blacks in the 1970’s: Did They Scale the Job Ladder?” Monthly Labor Review, June 1982: 29–38. https://stats.bls.gov/opub/mlr/1982/06/art5full.pdf.
White House. 2022. Fact Sheet: Biden-Harris Administration Releases Action Plan to Address Racial and Ethnic Bias in Home Valuations (statements and releases). March 23, 2022.
Wilson, Valerie. 2019. “The Raise the Wage Act of 2019 Would Give Black Workers a Much-Needed Boost in Pay” (economic snapshot). Economic Policy Institute, February 2019.
Wilson, Valerie, and William A. Darity. 2022. Understanding Black-White Disparities in Labor Market Outcomes Requires Models That Account for Persistent Discrimination and Unequal Bargaining Power. Economic Policy Institute, March 2022.
Wilson, Valerie, and Adewale Maye. 2022. “The Labor Market Recovery and Pandemic Relief Measures Lifted Black and Brown Workers and Families in 2021.” Working Economics Blog (Economic Policy Institute). September 15, 2022.
Yang, Jenny R., and Jane Liu. 2021. Strengthening Accountability for Discrimination: Confronting Fundamental Power Imbalances in the Employment Relationship. Economic Policy Institute.