Introduction and key findings
Workers today paid the federal minimum wage of $7.25 per hour are making 25 percent less than their counterparts made in 1968, despite the fact that the nation’s productivity has roughly doubled since then. Concern that low-wage workers are being deprived of the wage increases their increased productivity should deliver has led local, state, and federal policymakers to propose minimum wage increases that exceed the minimum wage increases that took effect in the 1990s and 2000s. Among the bolder proposals is a 2017 bill introduced by Sens. Bernie Sanders (I-Vt.) and Patty Murray (D-Wash.) to increase the federal minimum wage to $15 an hour by 2024, which would raise the minimum wage above its inflation-adjusted peak value in 1968. California, Washington, D.C., and a number of local jurisdictions have also recently passed laws phasing in a $15 minimum wage, while other jurisdictions are considering such increases, or have enacted smaller but still significant increases (Cooper 2017; EPI 2018).
In this paper we show that the need to “go bold” calls for a more standard policy evaluation framework that assesses the costs and benefits for low-wage workers rather than a singular focus on potential employment losses:
- The existing research on minimum wage policies justifies bolder increases than in the 1990s and 2000s. Federal and state governments enacted more modest minimum wage increases in the 1990s and 2000s, and these increases did not lead to substantial employment losses. This suggests that we could have pursued larger increases with few negative consequences for low-wage workers.
- Critics who cite claims of job loss to reject bolder minimum wage increases are using a distorted evaluation framework that focuses only on the potential costs of raising the minimum wage and ignores the benefits of raising low-wage workers’ total earnings.
- For example, the Congressional Budget Office studied the effect of a 2013 proposal to raise the federal minimum wage to $10.10 by 2016 (CBO 2014). While coverage of the study highlighted CBO’s estimate of 500,000 jobs lost, we show that 97.1 percent of workers directly affected by the minimum wage increase would be clear winners (remaining employed and earning more per year) and that the overall pool of wages earned by low-wage workers would expand substantially. This more complete description of the findings shows that the benefits of the policy far outweigh the estimated costs.
- Focusing on job losses ignores the high degree of churn in the low-wage labor market, giving the misleading impression that a given pool of workers would lose their jobs and have no earnings over an entire year. The more likely scenario is that what is lost are job hours, and that these lost hours are spread among the affected workers, who work a little less but earn more per year.
- The binary depiction of the low-wage labor market as one where individuals either consistently work or are excluded from work for the entire year likely overstates the costs of any employment reduction due to an increase in the minimum wage.
- We show that low-wage workers cycle into and out of employment often during the year. In fact, the monthly rate of churn into and out of employment for low-wage workers is roughly twice as high as it is for the typical worker in the middle of the wage distribution.
- Because worker turnover in the low-wage labor market is already high, any reduction in total hours worked by the low-wage workforce is likely to be shared by many low-wage workers in the form of fewer weeks worked throughout the year and longer spells in between jobs.
- CBO (2014) estimated that raising the minimum wage from $7.25 to $10.10 would increase the hourly wages of 17 million directly affected workers by 14.5 percent, prompting employers to reduce employment by 500,000, or 2.9 percent of those directly affected workers. If these employment declines were spread out over the entire group, i.e., all 17 million lost some hours but no workers were out of work for an entire year, all affected workers would be better off, working a little less (2.9 percent fewer hours) but enjoying an annual income increase of 11.6 percent. Other scenarios are possible, but given the high degree of labor market churn for low-wage workers, it is reasonable to assume that hours reductions are widely shared rather than entirely borne by one group of workers.
As this paper shows, the case against a bold increase in the federal minimum wage is flawed. Critics of a bold increase in the minimum wage would deprive low-wage workers of a deserved pay raise without evidence that this pay raise would hurt them overall. Even a fairly bold proposal to raise the minimum to $12 in 2020 would have only lifted the real value of the minimum wage to 13.1 percent above its 1968 value, a minimal improvement given how much productivity—the economy’s capacity to pay higher wages—has grown over these 50 years. Any effort to substantially improve earnings of low-wage workers will require minimum wage increases bolder than the increases legislated in the 1990s and 2000s.
Little downside from prior minimum wage raises justifies bolder increases
Critics of minimum wage increases ignore the overwhelming evidence that prior increases have, on average, had little to no average effect on the employment level of low-wage employees like teenagers and restaurant workers.1 The evidence showing small-to-no employment effects from smaller minimum wage raises implies that much bolder increases like $15 in 2024 are economically justified. Otherwise, policymakers will effectively deprive low-wage workers of wage increases they could have had without costing them much in terms of reduced employment.
In the most recent meta-analysis of academic studies on minimum wage increases published between 2000 and 2015, Paul Wolfson and Dale Belman (Wolfson and Belman 2016) find that a 10 percent increase in the minimum wage would reduce employment by only about 0.6 percent. This small effect is an average of all 739 estimates from the 37 papers Wolfson and Belman review. Allegretto et al. (2017) finds that studies using the most credible research designs (i.e., high-quality comparisons of jurisdictions that have raised minimum wages with jurisdictions that have not) also find small-to-no employment effects. That is, both the average study as well as the best research show that there has been little downside to raising minimum wages.
This does not mean that all questions about minimum wages and employment have been settled. But, as economists Michael Reich and Jesse Rothstein observe, the scholarly disagreement about employment effects of prior increases is largely confined to a narrow range of estimates:
Empirical evidence to date clearly indicates small employment effects of past minimum wage increases, though there is no consensus whether the impact has been a small negative or small positive effect. (Reich and Rothstein 2017)
The research underlying these assessments of minimum wage increases comes from a large set of state and federal minimum wage increases since the 1980s, the bulk of which occurred during the 1990s and 2000s. An increase of the federal minimum wage to $15 by 2024 is high enough to be outside that evidence base for many areas of the country. Because minimum wages have been relatively low for multiple decades, moving outside that evidence base is necessary to increase the minimum wage to a level above where it was nearly 50 years ago. In 2016, workers paid the federal minimum wage of $7.25 were paid 25.1 percent less per hour than the historical peak of inflation-adjusted minimum wages in 1968, which was $9.68 per hour in 2016 dollars. Were the minimum wage raised to $15 by 2024 it would be equivalent to $12.46 in 2016 dollars, 28.7 percent above the 1968 value of the minimum (Cooper 2017).
Such an increase is outside of our limited set of historical experiences and therefore, unlike previous increases, we cannot rely on the existing research base to guarantee that there will not be detectable, negative effects on employment. At the same time, the existing research justifies a bolder increase because it shows that prior minimum wage raises have caused no clear, large negative effects on employment. If policymakers continue to enact modest and infrequent increases to the minimum wage, they leave money on the table that otherwise could have been earned by low-wage workers. That is, since we know that prior minimum wage increases have had little detectable downside, a failure to enact a bolder increase in the minimum wage deprives low-wage workers of significant wage increases that wouldn’t cost much in terms of negative employment consequences.
Any potential employment reductions are of course undesirable, everything else being equal. But increasing minimum wages only to a point well short of spurring potential negative employment effects yields two undesirable outcomes. First, we never give the lowest-paid workers a raise above their hourly wage five decades ago, essentially guaranteeing that they never benefit from overall productivity growth in the economy. Failing to raise low-wage workers pay in line with the economy’s capacity to pay higher wages only further widens the wedge between low-wage worker pay and productivity growth, even though low-wage workers in general are older and are more experienced than their counterparts in past decades and have made considerable efforts to upgrade their educational attainment (Schmitt and Jones 2012). Second, we fail to provide low-wage workers, their families, and their communities with pay raises that cost low-wage workers themselves little in terms of negative employment consequences.
Focusing only on ‘job loss’ is a distorted criterion for evaluating minimum wage proposals
As Howell, Fiedler, and Luce (2016) have argued, public discussion of various minimum wage proposals, including among economists, tends to center on whether there will be job loss. In effect, minimum wage proposals are being evaluated as worthwhile only if researchers can prove that there will be no job loss and no negative costs of the policy for low-wage workers. This dynamic was apparent when the CBO released its 2014 analysis of a proposal to raise the federal minimum wage to $10.10 by 2016. The headline of a USA Today article on the report represents how the media in general covered the findings: “CBO Report: Minimum Wage Hike Could Cost 500,000 Jobs” (Davis 2014).
This job-loss framing is distinctly different than the conversations evaluating every other type of economic policy and biases the public’s consideration of wage proposals against the bold approach that is needed to help low-wage workers out of the deep hole that they are in after decades of inadequate increases in the minimum wage (Howell, Fiedler, and Luce [2016] have labeled this view as the “No-Job-Loss Criterion”). Focusing only on job loss ignores one of the main effects of minimum wage increases: rising hourly and annual earnings for potentially tens of millions of low-wage workers—many more of whom will gain than lose. In this section, we explain that even if one accepts estimates of job losses at face value, the increased income generated by raising the minimum wage will strongly outweigh these employment costs. To illustrate this point, we highlight the benefits and costs estimated by the CBO in its 2014 analysis. In the next section we also show that high turnover in the low-wage labor market means that employment loss estimates likely overstate the potential negative consequences of the policy on the low-wage workforce.
Many policies have both costs and benefits and we evaluate them by fully accounting for both. Policymakers across the political spectrum, for example, support the earned income tax credit (EITC) for its benefits of increasing labor force participation and raising annual post-tax incomes of low-income workers. This support for the EITC is high even though research (Rothstein 2010) has shown that it subsidizes low-wage employers and lowers pre-tax hourly wages, which can reduce the post-tax income of workers who do not qualify for the credit . In short, the size of the EITC’s income-increasing benefits relative to its negative costs leads to broad-based support for the policy. There are of course other considerations in evaluating policies—like the moral argument for a living wage policy additionally developed by Howell, Fiedler, and Luce (2016)—but here we more narrowly concentrate on a cost-benefit analysis.
Below we reexamine the findings of the 2014 CBO study, which is relevant because the same discussion will reoccur when CBO releases its analysis of the proposal to increase the federal minimum wage to $15 minimum, and since CBO’s new analysis will likely rely on a similar methodology. To be clear, this section does not constitute an endorsement of the CBO methods or conclusions, but instead simply highlights how standard findings in analyses of minimum wage increases are frequently misinterpreted by the public and misused by opponents of minimum wage increases.
Table 1 provides the key data points from CBO’s 2014 study. As the first panel of Table 1 shows, CBO found that if the federal minimum wage rose from $7.25 to $10.10 by 2016, 17 million workers would directly receive a wage increase because they otherwise would earn below $10.10. After accounting for 8 million indirectly affected workers (workers currently earning just above $10.10, who would get wage increases as employers adjusted overall pay ladders), a total of 25 million workers would receive a wage increase, CBO found. The second panel of the table presents CBO’s estimate that annual wages of directly affected workers would rise by 14.5 percent. The third panel of the table presents CBO’s estimate that this 14.5 percent wage increase would cause employers to reduce hiring of directly affected workers and thus that overall employment would fall by 0.5 million, relative to what employment would have been in the absence of the minimum wage increase.
CBO (2014) analysis of the effects of raising the minimum wage to $10.10 in 2016
| Workers affected by $10.10 in 2016 (millions) | |
|---|---|
| Directly affected workers | 17.0 |
| Indirectly affected workers | 8.0 |
| Total affected workers | 25.0 |
| CBO’s estimated wage increase for directly affected workers | 14.5% |
| CBO’s estimated employment change from wage increase for directly affected workers (millions) | -0.5 |
| Share of directly affected that CBO methodology implies … | |
| … will remain employed | 97.1% |
| … will become nonemployed | 2.9% |
| Share of all directly & indirectly affected that CBO methodology implies … | |
| … will remain employed | 98.0% |
| … will become nonemployed | 2.0% |
Notes: The average wage increase is the average of the CBO projected increases for teens (18 percent) and adults (14 percent), weighted by these groups’ shares of the population earning less than $11.50 (12 percent and 88 percent, respectively). “Nonemployed” means the individual is unemployed or not in the labor force.
Source: Employment levels and changes and wage changes are from CBO 2014
Researchers and analysts have criticized CBO’s analysis for making assumptions too pessimistic about employment reductions (Schmitt 2014, Reich 2014). For example, CBO’s analysis assumes a relatively high responsiveness, or elasticity, of teen employment to wages compared with other studies that find smaller employment effects for teens (Dube, Lester, Reich 2016; Allegretto et al. 2017). If CBO were to assume an employment elasticity in line with this other research, its job loss estimates would be lower.
Nevertheless, even if we take CBO’s estimates at face value, the benefits of the higher minimum wage far outweigh the losses in employment, a conclusion obscured by the singular focus on job losses. The fourth panel of Table 1 shows that if CBO is correct and the proposal led to 0.5 million fewer jobs, this would mean that 2.9 percent of directly affected workers would experience a job loss. This implies—again, taking CBO’s results for granted—that, on average at any point in time, 97.1 percent of 17 million workers would remain employed and have an hourly wage that is 14.5 percent higher. The employment costs of the policy are even lower when we compare them with the entire directly and indirectly affected workforce receiving wage increases (CBO assumed that indirectly affected workers would not experience any employment reductions). In that case, 98.0 percent of directly and indirectly affected workers would remain employed and receive a sizable wage increase and only 2 percent would suffer a job loss. Overall, the overwhelming share of workers affected benefit from the minimum wage increase.
In addition, CBO’s assumptions about the responsiveness of employment to wage changes also imply that annual earnings rise for low-wage workers as a whole, measured as the total pool of wages or as the average worker’s annual wage. Wages for directly affected workers rise by 14.5 percent but employment declines by only 2.9 percent. Total annual earnings of directly affected workers therefore increase by roughly 11.6 percent. The assumptions used by CBO imply that, on average, low-wage workers receive annual earnings increases, despite the employment decline. If one group consisting of 2.9 percent of directly affected workers bore the entire employment loss, then they would see annual earnings reductions while the vast majority of low-wage workers (both directly and indirectly affected) would still be far better off in terms of having higher average annual earnings.
That incomes for the low-wage workforce as a whole will rise is uncontested by even the most dogmatic critics of minimum wages, like former Heritage Foundation research fellow James Sherk, who now works for the Trump administration. In a 2016 analysis of raising the federal minimum wage to $15 by 2021 (a larger increase than the current $15 in 2024 proposal) Sherk’s preferred estimate of how responsive employment is to wage changes is three times as large as the implied elasticities used by CBO (Sherk 2016). Sherk’s assumptions about the responsiveness of employers to higher wages are not supported by existing research on minimum wages or by other estimates of labor demand responses generally (Wolfson and Belman 2016; Beaudry, Green, and Sand 2014). Nevertheless, even Sherk’s pessimistic conclusions about the minimum wage still imply that the average low-wage worker is better off and that the total annual wages of low-wage workers would increase. In short, much of the existing research base highlights that even if all potential employment losses resulting from minimum wage increases were concentrated on one group of workers, the gains to the low-wage workforce as a whole are clearly positive.2
Estimates of job loss overstate the costs to workers in a high-churn labor market
The discussion of minimum wage increases is distorted not only by the focus on costs at the exclusion of benefits, but also by the binary way that economists and policymakers too often portray the labor market. A point-in-time snapshot of a world in which people either work or are excluded from work does not reflect workers’ experiences over the course of a year. Workers in fact move in and out of employment, and the low-wage workforce in general has a high degree of turnover. This means that the binary portrayal of work will take job loss estimates such as those of CBO and likely overstate the costs to real workers.
Consider again CBO’s estimate that raising the minimum wage to $10.10 by 2016 would directly affect 17 million workers and lead to 0.5 million (2.9 percent) fewer jobs. Several scenarios would be consistent with a finding that employment at any point in time is 0.5 million jobs lower due to the minimum wage increase. For example, at one extreme 0.5 million people lose their jobs and would have zero wage income for the entire year. These 0.5 million people would indeed be unambiguous losers from the policy. At the other extreme, all 17 million directly affected individuals lose some (2.9 percent), but not all, hours of work during the year. In this case, each of these 17 million workers would be earning 14.5 percent more per hour, but working 2.9 percent fewer hours during the year, leading to an unambiguous 11.6 percent increase in annual earnings with no single worker “losing” due to the policy.
Of course, if the CBO estimate of overall employment loss were correct, how this loss is actually distributed among the low-wage workforce would likely be in between these two extreme scenarios. Nevertheless, it seems clear that at least some of the estimated job loss would mean that some people work less per year but earn more over the course of the year.
In fact, economists recognize that the large amount of churn in the low-wage labor market means that the potentially negative costs of a minimum wage increase would be shared across a large swath of the low-wage workforce. In his evaluation of increases to the Canadian minimum wage, David Green writes, “there is enough turnover in this part of the labour market that one would expect that the employment effects and the wage benefits [of the minimum wage] will be shared broadly, in the sense that we would not expect to see one group of workers permanently laid off and another group permanently getting higher wages” (Green 2015). In a journal article, Richard Freeman observes that although there is a concern that “employed low-paid workers benefit from the minimum, but the disemployed lose… [in] the United States, where job turnover is high and durations of joblessness relatively short, this is unlikely to be a serious problem. Low-paid workers will effectively ‘share’ the benefits of higher-paid minimum wage work through normal mobility and turnover” (Freeman 1996).
In addition, the shared burden of employment reductions in a high-churn labor market is actually part of CBO’s analysis of the effects of a minimum wage increase on annual family income, even though the CBO and the media do not emphasize this feature of the labor market. In the appendix to its study the CBO explains,
Because many low-wage workers move in and out of employment within a year, CBO estimated the effects of the employment loss among low-wage workers by assuming that the affected people worked, on average, about half as many weeks as they otherwise would have; CBO therefore lowered projected earnings by 50 percent for twice as many workers as the projected number of people who would become jobless (rather than lowering earnings by 100 percent for a number of workers equal to the number of people who would become jobless). (CBO 2014)
The general principle that a 2.9 percent reduction in total hours and thus earnings worked will be shared among more than just 2.9 percent of workers is correct. But CBO has no research basis to assume that annual hours and thus earnings fall by 50 percent for 5.8 percent of the affected workforce. Instead, CBO could have assumed that annual hours and thus earnings fall by 14.5 percent for 20 percent of affected workers, or that annual hours fall by 2.9 percent for 100 percent of workers. Because the average wage increase projected by CBO was about 14.5 percent, each of these other alternatives necessarily implies that, in terms of annual income, no worker will be made worse off by the policy and the overwhelming share of workers will receive annual income increases.
The important lesson is not the exact accounting of how any estimated job loss is shared, but that job loss and thus earnings loss is unlikely to be entirely borne by one group of workers. Indeed, as the examples above show, if the reduction in hours worked is shared broadly enough, no one worker sees a reduction in total annual income and all workers are better off because of the minimum wage increase. As we demonstrate in the next two sections, the low-wage labor market already exhibits a high degree of churn—workers constantly move in and out of employment. Thus, employment reductions due to significantly higher minimum wages are likely to take the form of longer spells of nonemployment (fewer hours worked over the course of a year) and not permanent exclusion from the labor market.
Low-wage workers have the highest rates of labor market churn
To assess whether the low-wage labor market indeed exhibits a disproportionate amount of turnover, we analyze worker churn by wage level using longitudinal data on workers from the Current Population Survey (CPS) between 1998 to 2016. We start with monthly matched versions of the basic CPS, available from the Integrated Public Use Microdata Series (IPUMS) (Flood et al. 2017), to link individuals across months and calculate transitions in and out of employment. We then use wage data from the Outgoing Rotation Group (ORG) subsample of the CPS to predict wages based on demographic characteristics for the entire CPS basic monthly sample. We find that workers with lower predicted wages have higher rates of labor market churn. (See the Methodology appendix for details on the matched sample.)
We define monthly churn to be movements from employment into nonemployment (EN) or movements from nonemployment to employment (NE). Here, nonemployment means either unemployment or not in the labor force. Because we can calculate only monthly transition indicators for individuals whose employment status we are able to observe over two consecutive months, we limit our sample to these observations, and to focus on the working-age population, we limit the sample to those ages 16 through 64. (The labor market also exhibits a substantial amount of job-to-job or employment-to-employment transitions, but in this paper we limit our measure of churn to EN and NE movements.)
About 5.5 percent of all working-age observations in our sample are churning each month—i.e., experiencing either a monthly NE or EN transition. However, this average of 5.5 percent masks substantial diversity across low- and high-wage workers.
Figure A shows the probability that an individual experiences an EN or NE event in any given month and how that rate of churn varies by predicted wages. For the figure, we divide the sample population into 20 predicted real wage quantiles and calculate the mean rate of churn for each quantile. Clearly, labor market churn, as measured by EN or NE transitions, is much higher for lower-wage workers and much lower for higher-wage individuals: individuals in the lowest quantile have monthly churn rates of 9.9 percent, whereas those with the highest wages have churn rates of only 2.3 percent. Relative to the middle or 10th-quantile churn of 4.8 percent, the churn rate for the lowest-wage workers is twice as high and the rate for the highest-wage workers is half as high.
Relationship between the probability that a worker experiences labor market churn in a given month and the worker's predicted wage
| realwage | churn |
|---|---|
| 7.434352 | 9.88513% |
| 9.10678 | 10.76906% |
| 10.35492 | 9.80829% |
| 11.48624 | 8.64150% |
| 12.5153 | 7.47603% |
| 13.47053 | 6.43255% |
| 14.32017 | 5.65531% |
| 15.06847 | 5.14252% |
| 15.75748 | 4.97294% |
| 16.47398 | 4.83643% |
| 17.23629 | 4.70312% |
| 18.04881 | 4.38314% |
| 18.92162 | 4.21641% |
| 19.89284 | 4.00430% |
| 21.14524 | 3.81151% |
| 22.76222 | 3.73829% |
| 24.79336 | 3.74201% |
| 27.41219 | 3.46091% |
| 30.4512 | 2.87849% |
| 35.79802 | 2.30744% |
Notes: Churn is a transition from employment to nonemployment or nonemployment to employment in a given month. The real wage is predicted by demographic characteristics, described in the methodological appendix.
Source: Real wage bins and churn rates calculated from monthly linked observations in the CPS 1998–2016
The monthly churn rates discussed measure whether an individual experiences an EN or NE transition in any given month for which we observe the worker in the prior and current month. We also calculate whether an individual experiences any transition over three consecutive months (the maximum number of consecutive months we observe an individual and are able to calculate transition indicators). For this exercise, we limit the sample to those individuals who are observed for three consecutive months, which constitutes about 89 percent of the original data sample.
Figure B compares the monthly churn rate (bottom line) and the probability of experiencing any churn in three consecutive months (top line) across the predicted wage distribution. Individuals predicted to be low-wage when employed are again substantially more likely to experience churn. Whereas the probability of experiencing an NE or EN transition in a given month for the lowest wage quantile is 9.8 percent, the probability of experiencing a transition over three consecutive months is 21.9 percent. Individuals in the highest-wage quantile experience a transition every three months only 4.9 percent of the time.
Relationship between the probability that a worker experiences labor market churn (in a given month and within three months) and the worker's predicted wage
| realwage | churn | Experiencing churn in a given month | Experiencing churn within 3 months |
|---|---|---|---|
| 7.480884 | 9.7901% | ||
| 9.187807 | 10.5088% | ||
| 10.47396 | 9.3662% | ||
| 11.63589 | 8.1423% | ||
| 12.68453 | 6.9709% | ||
| 13.64466 | 5.9325% | ||
| 14.48068 | 5.2303% | ||
| 15.2132 | 4.8484% | ||
| 15.89337 | 4.6669% | ||
| 16.61739 | 4.5671% | ||
| 17.37792 | 4.4482% | ||
| 18.19302 | 4.1060% | ||
| 19.06374 | 4.0023% | ||
| 20.04742 | 3.7575% | ||
| 21.32327 | 3.6075% | ||
| 22.96903 | 3.5500% | ||
| 25.00872 | 3.5918% | ||
| 27.62886 | 3.2848% | ||
| 30.61915 | 2.7366% | ||
| 35.92942 | 2.1860% | ||
| 7.480884 | 21.9102% | ||
| 9.187807 | 23.4950% | ||
| 10.47396 | 20.8331% | ||
| 11.63589 | 18.1116% | ||
| 12.68453 | 15.4632% | ||
| 13.64466 | 13.1537% | ||
| 14.48068 | 11.5970% | ||
| 15.2132 | 10.7341% | ||
| 15.89337 | 10.3792% | ||
| 16.61739 | 10.1731% | ||
| 17.37792 | 9.8683% | ||
| 18.19302 | 9.1003% | ||
| 19.06374 | 8.8977% | ||
| 20.04742 | 8.3930% | ||
| 21.32327 | 8.0474% | ||
| 22.96903 | 7.9163% | ||
| 25.00872 | 7.9330% | ||
| 27.62886 | 7.2738% | ||
| 30.61915 | 6.0991% | ||
| 35.92942 | 4.8904% |
Notes: Churn is a transition from employment to nonemployment or nonemployment to employment in a given month. The real wage is predicted by demographic characteristics.
Source: Real wage bins and churn rates derive calculated from monthly linked observations in the CPS, 1998–2016
The first important implication from Figures A and B is that low-wage workers are already frequently moving in and out of employment. A low-wage worker’s labor market experience is more accurately described by spells of employment and nonemployment throughout the year. As a consequence, we should expect that some of any measured job loss due to a minimum wage increase would be borne by workers having longer nonemployment spells but earning more when they do work and more over the course of a year.
Second, both figures are consistent with the idea that there is room for reductions in turnover among low-wage individuals. One explanation for why previous minimum wage increases have not led to sizable decreases in employment is that the increases reduce worker turnover: employers hire fewer workers in response to a minimum wage increase, but fewer workers leave their jobs (Dube, Lester, and Reich 2016). The reduction in job separations is a potentially important source of cost savings among low-wage employers, whose establishments experience high rates of turnover.
The figures show that there is substantial scope for turnover-based cost savings at levels of the minimum wage much higher than the current national minimum of $7.25 per hour. At the same time, the churn–wage curve in the figures becomes vastly less steep beginning around $14 to $15 per hour, suggesting that opportunities to reduce turnover may diminish quickly at sufficiently high wage levels.
Establishments in low-wage industries typically lose jobs
Industries that generally pay low wages also see much higher churn than do establishments in higher-wage industries. Establishments in low-wage industries are significantly more likely to be losing jobs as these establishments either contract by shrinking their payroll employment or close entirely. To show that establishments in low-wage industries are more likely to experience job loss on a normal basis, we turn to establishment-based data from the Bureau of Labor Statistics Business Employment Dynamics. We use the quarterly data from 2016, the latest complete year of data available at the time of our analysis.
The share of establishments with shrinking employment is relatively high in a given quarter. On average, in each quarter in 2016, 25.3 percent of all establishments in the private sector lost jobs through contracting or closing. Figure C shows, for each of 86 detailed industries, the relationship between average monthly pay per worker in that industry and the share of establishments in that industry that are losing jobs in a given quarter. Low-wage industries are significantly more likely than high-wage industries to have higher shares of establishments that are losing jobs. The shares of job-losing establishments range from 18.1 percent for industries at the 5th percentile and 36.7 percent at the 95th percentile of industries in 2016.
Share of establishments in industries losing jobs by average wage
| Log wage | Jobless rate |
|---|---|
| 0.96737987 | 33.775 |
| 1.1091862 | 26.175 |
| 1.3130114 | 27.375 |
| 1.685401 | 29.9 |
| 0.96158272 | 31.275 |
| 2.6000793 | 26.125 |
| 1.8197374 | 33.325 |
| 1.9426714 | 37.45 |
| 1.6734489 | 27.275 |
| 1.7654746 | 34.7 |
| 1.5104624 | 29.05 |
| 1.3483243 | 32.825 |
| 1.4822435 | 31.55 |
| 1.3170942 | 32.8 |
| 1.204138 | 28.125 |
| 1.2025074 | 33.7 |
| 1.2803384 | 29.925 |
| 1.2638997 | 31.525 |
| 1.7033619 | 34.475 |
| 1.3905784 | 25.425 |
| 2.2418473 | 30.475 |
| 2.0578389 | 29.025 |
| 1.4600399 | 33.1 |
| 1.5379068 | 31.6 |
| 1.6878145 | 36.475 |
| 1.5166795 | 31.175 |
| 1.7289417 | 31.75 |
| 2.2553766 | 29.65 |
| 1.6948208 | 31.2 |
| 1.7980245 | 34.1 |
| 1.2875587 | 28.375 |
| 1.6424034 | 24.625 |
| 1.8005402 | 22.55 |
| 1.7003907 | 23.85 |
| 2.0861564 | 14.925 |
| 1.3999984 | 28 |
| 1.0889176 | 26.15 |
| 1.332688 | 27.75 |
| 1.007045 | 27.9 |
| 0.68491399 | 28.325 |
| 1.1567641 | 28.525 |
| 0.55466306 | 27.825 |
| 0.5991962 | 33.475 |
| 0.54526156 | 33.35 |
| 0.65489507 | 37.7 |
| 0.76739699 | 28.3 |
| 1.6040484 | 23.975 |
| 1.9550499 | 25.925 |
| 1.9439162 | 32.175 |
| 1.4018718 | 27.4 |
| 0.92435342 | 32.475 |
| 2.3264701 | 19.3 |
| 0.99185085 | 35.7 |
| 1.4923086 | 25.325 |
| 1.3332609 | 28.25 |
| 1.2651267 | 29.65 |
| 2.1895998 | 24.075 |
| 1.6960169 | 30.4 |
| 1.9579673 | 28.75 |
| 1.9718236 | 26.125 |
| 2.1804359 | 22.875 |
| 2.6820626 | 21.775 |
| 1.8853207 | 23.575 |
| 2.875545 | 17.2 |
| 1.9239706 | 18.6 |
| 2.4163854 | 18.125 |
| 1.5518119 | 18.025 |
| 1.4010694 | 27.275 |
| 2.1538174 | 19.725 |
| 2.0281248 | 22.1 |
| 2.2662499 | 24.725 |
| 1.1301051 | 29.95 |
| 1.5696044 | 28.675 |
| 1.4053417 | 30.4 |
| 1.6094944 | 23.625 |
| 1.6282188 | 35.425 |
| 0.92779571 | 34.2249999999999 |
| 0.64582467 | 13.9 |
| 1.9966158 | 28 |
| 1.0413699 | 30.55 |
| 0.61341447 | 37.4 |
| 0.92650622 | 36.7 |
| 0.42424598 | 37.25 |
| 1.2660459 | 21.625 |
| 0.7848931 | 23.75 |
| 1.2638997 | 21.6 |
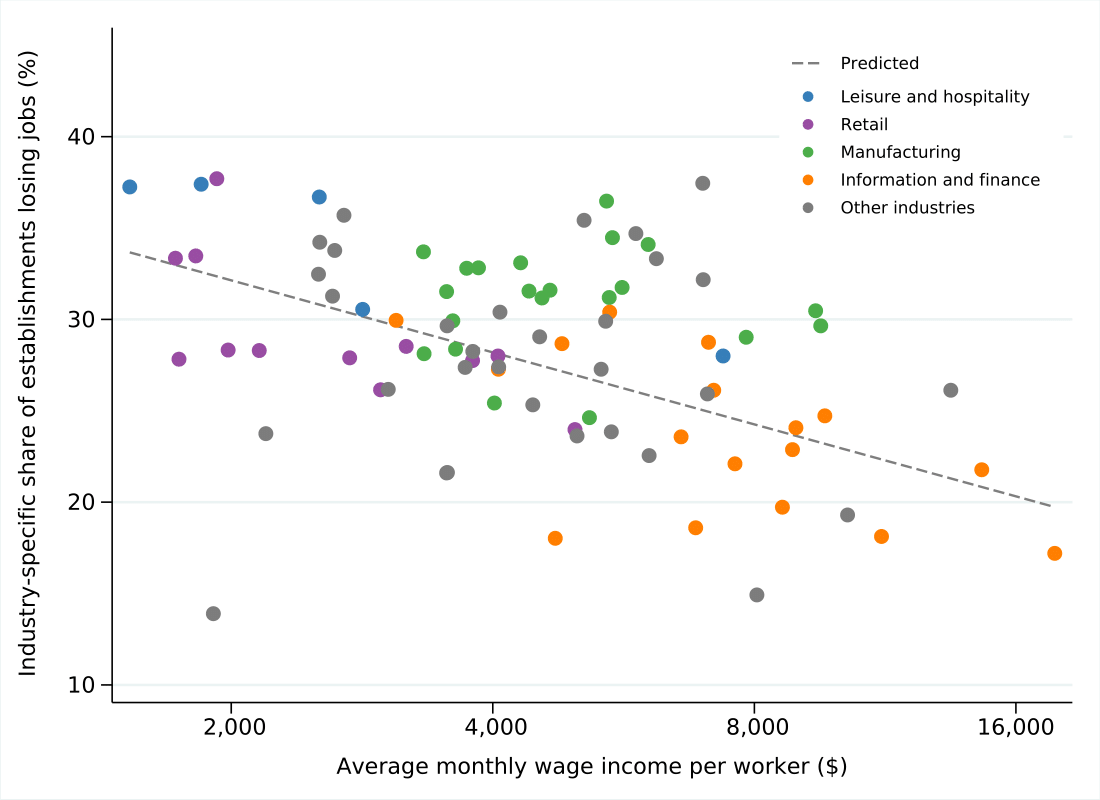
Notes: Horizontal axis is on a logarithmic scale. Establishments losing jobs are those with contracting employment or closures. All values are the annual mean of quarterly data. The prediction is a linear regression of the share of establishments on the logarithm of monthly wage income, weighted by industry employment.
Source: Authors’ calculations from BLS Business Employment Dynamics and Quarterly Census of Employment and Wages data for 3-digit NAICS industries in 2016
The restaurant industry (coded as “Food Services and Drinking Places” in the data) has one of the highest shares of shrinking establishments. In the average quarter of 2016, 37.3 percent of all restaurants were shrinking because they were contracting or closing, and the average monthly wage income in that industry was about $1,500. On the opposite end of the pay scale, only 17.2 percent of establishments in the financial securities industry (“Securities, Commodity Contracts, and Investments”) were shrinking over a quarter, and the average monthly wage income was about $18,000. The establishment-based data showing higher rates of employment losses in low-wage industries is consistent with the worker-level data described above, showing higher rates of churn in the low-wage labor market.
Conclusion
Many policymakers, worker advocates, and voters support bolder minimum wage increases because they recognize that minimum wage workers should be paid more per hour than they were paid five decades ago in 1968 when the federal minimum wage reached its historical inflation-adjusted peak. Productivity has increased significantly since that time, so workers should reap some of these benefits. By raising the federal minimum wage to $15 in 2024, the minimum wage would exceed its inflation-adjusted value in 1968, as would other bold proposals now politically viable in many cities and states.
As this paper has shown, the conventional narrow focus on the employment consequences of minimum wage increases is highly flawed: it inaccurately characterizes eroded work hours as simply “jobs lost” and it inappropriately establishes “no job loss” as the yardstick against which any minimum wage proposal must be judged.
First, we demonstrated that academic research actually justifies a bolder minimum wage increase than the increases that have been legislated to date, because prior increases have not been accompanied by substantial employment declines (meaning we are leaving raises for low-wage workers on the table).
Second, we used CBO’s 2014 analysis of the $10.10 proposal to illustrate that job loss is a narrow and incomplete framework for judging a proposed increase in the minimum wage. We showed that even accepting CBO’s estimated 500,000 jobs lost equates to 98 percent of directly and indirectly affected workers being clear winners, i.e., would remain employed and receive a sizable wage increase. In addition even accepting these negative estimates at face values implies that the minimum wage increases average annual earnings of low-wage workers as a whole.
Third, we document that there is substantial churn in the low-wage labor market, which implies that low-wage workers who experience employment reductions are actually experiencing reduced total annual hours of work, through fewer weeks worked and longer spells in between jobs, rather than a job loss that lasts the whole year. The more churn there is in the low-wage labor market, the more widely the job losses will be spread among workers in the form of lost hours, and thus the more likely that workers will come out ahead, working fewer annual hours at a higher hourly wage, and thus earning more over the course of a year.
About the authors
David Cooper joined the Economic Policy Institute in 2011. He conducts national and state-level research, with a focus on the minimum wage, employment and unemployment, poverty, and wage and income trends. He also coordinates and provides technical support to the Economic Analysis and Research Network (EARN), a national network of 59 policy research and advocacy organizations across 43 states plus the District of Columbia. Cooper has testified in a half-dozen states on the challenges facing low-wage workers and their families. His analyses on the impact of minimum wage laws have been used by policymakers and advocates in city halls and statehouses across the country, as well as in Congress and the White House. Cooper has been interviewed and cited by numerous local and national media, including The New York Times, The Washington Post, The Wall Street Journal, CNBC, and NPR. He received his master of public policy degree from Georgetown University.
Lawrence Mishel is a distinguished fellow at the Economic Policy Institute after serving as president from 2002–2017. Mishel first joined EPI in 1987 as research director. He is the co-author of all 12 editions of The State of Working America. He holds a Ph.D. in economics from the University of Wisconsin at Madison, and his articles have appeared in a variety of academic and nonacademic journals. His areas of research are labor economics, wage and income distribution, industrial relations, productivity growth, and the economics of education.
Ben Zipperer joined the Economic Policy Institute in 2016. His areas of expertise include the minimum wage, inequality, and low-wage labor markets. He has published research in the Industrial and Labor Relations Review and has been quoted in outlets such as The New York Times, The Washington Post, Bloomberg, and the BBC. Prior to joining EPI, Zipperer was research economist at the Washington Center for Equitable Growth. He has a Ph.D. in economics from the University of Massachusetts, Amherst.
Methodology
The Current Population Survey is a monthly survey of households where each respondent is interviewed for four consecutive months, then not interviewed for eight months, and then interviewed again for the final four consecutive months. Although the CPS is largely designed for cross-sectional analysis, several related methods are available for matching respondents across months. For simplicity we use the longitudinal identifier constructed by IPUMS, described in Rivera Drew, Flood, and Warren (2014). This identifier has been relatively consistently coded since 1995. But since IPUMS does not provide the basic monthly weights necessary to replicate the monthly labor market statistics published by the Bureau of Labor Statistics, we construct these weights (the “composite final weight”) by matching the IPUMS records with the raw CPS data available at the National Bureau of Economic Research. This final restriction limits our sample to 1998 through 2015. Because we can only calculate monthly transition indicators for individuals whose employment status is provided over at least two consecutive months, we further limit our sample to these observations (generally interview months two–four and six–eight, although some observations are not observed for these six months due to nonresponse issues). To focus on the working-age population, we additionally limit the sample to those ages 16 through 64.
As we describe below, we predict wages for all working and nonworking individuals using demographic characteristics. Using predicted wages to capture the latent wage of any individual as opposed to actual reported wages has two additional advantages. First, actual wages are only available for the ORG subsample of the basic monthly data (interview months four and eight). Were we to limit the sample to the ORG, we would not be able to assign a wage to an individual if, say, she were employed in month three but not employed in month four. In contrast, we substantially expand the available sample of data by using out-of-sample prediction of wages based on the ORG subsample for the full sample of individuals in the basic monthly CPS. Second, we avoid the possible complication that high or low wages for an individual in the current month may be the reason we observed a transition in the first place. For example, using actual wages could overstate the heterogeneity of churn across wage levels if abnormally low actual wages in the prior month led to labor market exit.
To predict wages, we simply estimate by ordinary least squares a wage equation using the ORG subsample of wage earners, regressing logarithm of hourly real earnings on a quintic polynomial in age, and dummies for race, Hispanic ethnicity, gender, marital status, education, state, and year, in which the regression is weighted by the ORG earnings sample weight. We calculate hourly earnings as the reported hourly wage for hourly workers, and, for nonhourly workers, weekly earnings divided by usual hours per week. We exclude self-employed workers from the regression sample. From the estimated coefficients on these covariates, we predict hourly wages for all individuals in the full basic monthly CPS. By construction, the predicted hourly wage for an individual will change as she ages, becomes more educated, etc., so we assign each individual her mean predicted hourly wage.
For the industry-level analysis, we used Business Employment Dynamics (BDM) data from the Bureau of Labor Statistics (BLS) for the share of establishments that saw job losses due to closings or contractions in 2016, for the overall private sector and for 86 three-digit NAICS (North American Industry Classification System) level industries. Average monthly earnings for each industry are from the 2016 BLS Quarterly Census of Employment and Wages, from which we also use industry-specific employment counts to weight the linear fit in Figure C.
Endnotes
1. Although most minimum wage workers are not restaurant employees or teenagers, most research concentrates on these groups because large shares of restaurant workers and teenagers earn low wages and are significantly affected by minimum wage increases.
2. There are studies that estimate much higher responsiveness of employment to wage increases (i.e., much higher labor demand elasticities). Sherk (2016) assumed a labor demand elasticity of about -0.7, but Neumark, Salas, and Wascher (2014) estimated employment effects for teens that imply a labor demand elasticity of close to -1. Allegretto et al. (2017) explain that the Neumark, Salas, and Wascher estimates are negatively biased. In a recent study of the Seattle minimum wage increase, Jardim et al. (2017) estimated a labor demand elasticity of roughly -3.0, but Zipperer and Schmitt (2017) explain that this estimate is likely to be negatively biased and therefore uninformative because the study used an invalid control group and had other data limitations.
References
Allegretto, Sylvia, Arindrajit Dube, Michael Reich, and Ben Zipperer. 2017. “Credible Research Designs for Minimum Wage studies: A Response to Neumark, Salas, and Wascher.” ILR Review 70, no. 3 (May): 559–592. https://doi.org/10.1177/0019793917692788.
Beaudry, Paul, David A. Green, and Ben Sand. 2014. “In Search of Labor Demand.” National Bureau of Economic Research Working Paper no. 20568, October 2014. https://doi.org/10.3386/w20568.
Bureau of Labor Statistics. 2018. Business Employment Dynamics. https://www.bls.gov/bdm/.
Bureau of Labor Statistics. 2018. Quarterly Census of Employment and Wages. https://www.bls.gov/cew/.
Congressional Budget Office (CBO). 2014. The Effects of a Minimum-Wage Increase on Employment and Family Income. February 18, 2014.
Cooper, David. 2017. Raising the Minimum Wage to $15 by 2024 Would Lift Wages for 41 Million American Workers. Economic Policy Institute, April 26, 2017.
Davis, Susan. 2014. “CBO Report: Minimum Wage Hike Could Cost 500,000 Jobs.” USA Today, February 18, 2014.
Dube, Arindrajit, T. William Lester, and Michael Reich. 2016. “Minimum Wage Shocks, Employment Flows, and Labor Market Frictions.” Journal of Labor Economics 34, no. 3 (July): 663–704. https://doi.org/10.1086/685449.
Economic Policy Institute (EPI). 2018. Minimum Wage Tracker. Last updated January 2, 2018.
Freeman, Richard. 1996. “The Minimum Wage as a Redistributive Tool.” Economic Journal 106, no. 436 (May): 639–649.
Flood, Sarah, Miriam King, Steven Ruggles, and J. Robert Warren. 2017. Integrated Public Use Microdata Series, Current Population Survey: Version 5.0. [data set]. Minneapolis: University of Minnesota. https://doi.org/10.18128/D030.V5.0.
Green, David. 2015. The Case for Increasing the Minimum Wage: What Does the Academic Literature Tell Us? Canadian Centre for Policy Alternatives.
Howell, David R., Kea Fiedler, and Stephanie Luce. 2016. “What’s the Right Minimum Wage? Reframing the Debate from ‘No Job Loss’ to a ‘Minimum Living Wage.’” Washington Center for Equitable Growth Working Paper 2016-06.
Jardim, Ekaterina, Mark C. Long, Robert Plotnick, Emma van Inwegen, Jacob Vigdor, and Hilary Wething. 2017. “Minimum Wage Increases, Wages, and Low-Wage Employment: Evidence from Seattle.” National Bureau of Economic Research Working Paper no. 23532, June 2017.
Neumark, David, J.M. Ian Salas, and William Wascher. 2014. “Revisiting the Minimum Wage and Employment Debate: Throwing Out the Baby with the Bathwater?” ILR Review 67, no. 3 (supplement): 608–648.
Reich, Michael. 2014. “The Troubling Fine Print in the Claim That Raising the Minimum Wage Will Cost Jobs.” ThinkProgress, February 19, 2014.
Reich, Michael, and Jesse Rothstein. 2017. “Do Minimum Wages Really Kill Jobs?” EconoFact, April 27, 2017.
Rivera Drew, Julia A., Sarah Flood, and John Robert Warren. 2014. “Making Full Use of the Longitudinal Design of the Current Population Survey: Methods for Linking Records across 16 Months.” Journal of Economic and Social Measurement 39, no. 3: 121–144. https://doi.org/10.3233/JEM-140388.
Rothstein, Jesse. 2010. “Is the EITC as Good as NIT? Conditional Cash Transfers and Tax Incidence.” American Economic Journal: Economic Policy 2, no. 1 (February): 177–208. https://dx.doi.org/10.1257/pol.2.1.177.
Sherk, James. 2016. Raising Minimum Starting Wages to $15 per Hour Would Eliminate Seven Million Jobs. Heritage Foundation, July 26, 2016.
Schmitt, John. 2014. “CBO and the Minimum Wage, Pt. 2.” CEPR Blog, Center for Economic and Policy Research website, February 20, 2014.
Schmitt, John, and Janelle Jones. 2012. “Low-Wage Workers Are Older and Better Educated Than Ever.” Center for Economic and Policy Research website, April 2012.
Wolfson, Paul, and Dale Belman. 2016. “15 Years of Research on U.S. Employment and the Minimum Wage.” Tuck School of Business Working Paper no. 2705499. Last revised December 14, 2016.
Zipperer, Ben, and John Schmitt. 2017. The ‘High Road’ Seattle Labor Market and the Effects of the Minimum Wage Increase. Economic Policy Institute, June 26, 2017.
