Total initial UI claims have risen in each of the last four weeks: Congress must act
Last week 1.6 million workers applied for unemployment insurance (UI) benefits. Breaking that down: 881,000 applied for regular state unemployment insurance, and 759,000 applied for Pandemic Unemployment Assistance (PUA).
This is the fourth week in a row that total initial claims have risen. Further, last week was the 24th week in a row total initial claims were far greater than the worst week of the Great Recession. If you restrict to regular state claims (because we didn’t have PUA in the Great Recession), claims are still greater than the second-worst week of the Great Recession. And remember this: People haven’t just lost their jobs. An estimated 12 million workers and their family members have lost employer-provided health insurance due to COVID-19.
There was a (mostly) positive methodological development with the release of the UI data this week—DOL changed their seasonal adjustment methodology. The way they had been doing seasonal adjustments was causing major distortions during this recession, and the change is a big improvement. One big problem, however, is that they didn’t revise prior seasonally adjusted data, which means you cannot compare seasonally adjusted numbers over time. So, remember this: It’s OK to use the seasonally adjusted numbers, but if you want to compare UI data over time, use non-seasonally-adjusted numbers.
An example of how to do it wrong: Some are saying regular state UI claims dropped by 130,000 last week (from 1.01 million to 881,000). That’s wrong because it’s comparing two seasonally adjusted numbers that were calculated using two different methods (the old way and the new way). Regular state UI claims actually ticked up by 7,600 last week, from 825,800 to 833,400 (using non-seasonally-adjusted data). Including initial PUA claims, total initial claims rose 159,000 last week, from 1.43 million to 1.59 million.
Figure A combines the most recent data on both continuing claims and initial claims to get a measure of the total number of people “on” unemployment benefits as of August 29. DOL numbers indicate that, right now, 30.9 million workers are either on unemployment benefits, have been approved and are waiting for benefits, or have applied recently and are waiting to get approved. But, importantly, Figure A is an overestimate of the number of people “on” UI, for two reasons: (1) Some individuals are being counted twice. Regular state UI and PUA claims should be nonoverlapping—that is how DOL has directed state agencies to report them—but some individuals are erroneously being counted as being in both programs. (2) Some states are including some back weeks in their continuing PUA claims, which would also lead to double-counting (the discussion around Figure 3 in this paper covers this issue well).
DOL numbers indicate that 30.9 million workers are either receiving unemployment benefits or have applied and are waiting to see if they will get benefits (as of August 29, 2020): *But caution---this is an overestimate due to reporting issues (see note)*
| Regular state UI: Continued claims | Regular state UI: Initial claims | PUA: Continued claims | PUA: Initial claims | Other programs (mostly PEUC, STC, and EB) | Total | |
|---|---|---|---|---|---|---|
| Cumulative | 13,254,000 | 881,000 | 13,570,327 | 1,367,290 | 1,862,342 | 0 |

Notes: This is an overestimate of the number of people “on” UI, for two reasons: (1) regular state UI and PUA claims should be nonoverlapping—that is how DOL has directed agencies to report them—but some individuals are erroneously being counted as being in both programs; (2) some states are including some back weeks in their continuing PUA claims, which would also lead to double-counting.
This is an overestimate of the number of people “on” UI, for two reasons: (1) regular state UI and PUA claims should be nonoverlapping—that is how DOL has directed agencies to report them—but some individuals are erroneously being counted as being in both programs; (2) some states are including some back weeks in their continuing PUA claims, which would also lead to double-counting. Seasonally adjusted data are not available for the other components of the chart. Regular state UI continued claims are for the week ending August 22; regular state UI initial claims are for the week ending August 29. PUA continued claims are for the week ending August 15; PUA initial claims are for the weeks ending August 22 and August 29. “Other programs” are continued claims in other programs for the week ending August 15. Pandemic Unemployment Assistance (PUA) is the federal program for workers who are out of work because of the virus but who are not eligible for regular state unemployment insurance (UI) benefits (e.g. the self-employed). “Other programs” includes PEUC, STC, EB, and others; a full list can be found in the bottom panel of the table on page 4 at this link: https://www.dol.gov/ui/data.pdf.
Source: Department of Labor (DOL) Unemployment Insurance Weekly Claims (News Release), retrieved from DOL, https://www.dol.gov/ui/data.pdf, September 3, 2020.
Figure B shows continuing claims in all programs over time (the latest data are for August 15). Continuing claims are more than 27 million above where they were a year ago. However, the above caveat about potential double-counting applies here too, which means the trends over time should be interpreted with caution. Further, the large jump in PUA claims was driven almost entirely by an increase in California from 3.1 million on August 8 to 5.4 million on August 15. This is a 76% increase, which is such a large jump that I assume it is being caused by an administrative issue.
Continuing unemployment claims in all programs: January 4, 2020–August 15, 2020
| Regular state UI | PUA | Other programs (mostly PEUC, STC, and EB) | |
|---|---|---|---|
| 2020-01-04 | 2,245,684 | 0 | 32,520 |
| 2020-01-11 | 2,137,910 | 0 | 33,882 |
| 2020-01-18 | 2,075,857 | 0 | 32,625 |
| 2020-01-25 | 2,148,764 | 0 | 35,828 |
| 2020-02-01 | 2,084,204 | 0 | 33,884 |
| 2020-02-08 | 2,095,001 | 0 | 35,605 |
| 2020-02-15 | 2,057,774 | 0 | 34,683 |
| 2020-02-22 | 2,101,301 | 0 | 35,440 |
| 2020-02-29 | 2,054,129 | 0 | 33,053 |
| 2020-03-07 | 1,973,560 | 0 | 32,803 |
| 2020-03-14 | 2,071,070 | 0 | 34,149 |
| 2020-03-21 | 3,410,969 | 0 | 36,758 |
| 2020-03-28 | 8,158,043 | 0 | 48,963 |
| 2020-04-04 | 12,444,309 | 0 | 64,201 |
| 2020-04-11 | 16,249,334 | 136,417 | 117,331 |
| 2020-04-18 | 17,756,054 | 994,850 | 168,467 |
| 2020-04-25 | 21,723,230 | 3,402,409 | 237,569 |
| 2020-05-02 | 20,823,141 | 6,102,381 | 338,016 |
| 2020-05-09 | 22,725,217 | 7,793,066 | 438,839 |
| 2020-05-16 | 18,788,626 | 10,740,918 | 435,871 |
| 2020-05-23 | 19,022,578 | 9,715,948 | 766,537 |
| 2020-05-30 | 18,548,442 | 9,374,248 | 1,336,818 |
| 2020-06-06 | 18,330,151 | 11,046,401 | 1,177,265 |
| 2020-06-13 | 17,552,371 | 12,853,484 | 1,105,692 |
| 2020-06-20 | 17,316,689 | 14,363,143 | 1,242,503 |
| 2020-06-27 | 16,410,059 | 14,282,999 | 1,310,272 |
| 2020-07-04 | 17,188,902 | 13,179,880 | 1,434,409 |
| 2020-07-11 | 16,220,937 | 12,413,332 | 1,568,239 |
| 2020-07-18 | 16,691,210 | 12,956,478 | 1,675,923 |
| 2020-07-25 | 15,700,971 | 10,723,396 | 1,832,583 |
| 2020-08-01 | 15,112,091 | 11,224,774 | 1,722,484 |
| 2020-08-08 | 14,098,403 | 10,972,770 | 1,946,059 |
| 2020-08-15 | 13,791,877 | 13,570,327 | 1,862,342 |
Notes: Data are not seasonally adjusted. Pandemic Unemployment Assistance (PUA) is the federal program for workers who are out of work because of the virus but who are not eligible for regular state unemployment insurance benefits (e.g., the self-employed). “Other programs” includes PEUC, STC, EB, and others; a full list can be found in the bottom panel of the table on page 4 at this link: https://www.dol.gov/ui/data.pdf.
Source: U.S. Employment and Training Administration, Initial Claims [ICSA], retrieved from Department of Labor (DOL), https://oui.doleta.gov/unemploy/docs/persons.xls and https://www.dol.gov/ui/data.pdf, September 3, 2020.
Republicans in the Senate allowed the across-the-board $600 increase in weekly UI benefits to expire at the end of July. Last week was the fifth week of unemployment in this pandemic for which recipients did not get the extra $600. That means most people on UI are now are forced to get by on the meager benefits that are in place without the extra payment, benefits that are typically around 40% of a worker’s pre-virus earnings. It goes without saying that most folks can’t exist on 40% of prior earnings without experiencing a sharp drop in living standards and enormous pain.
Earlier this month, President Trump issued a mockery of an executive memorandum. It was supposed to give recipients an additional $300 or $400 in benefits per week. But in reality, even this drastically reduced benefit will be extremely delayed for most workers, is only available for a few weeks, and is not available at all for many. The executive memorandum’s main impact was to divert attention from the desperate need for the real relief that can come only through legislation. Congress must act, but Republicans in the Senate are blocking progress.
Blocking the $600 is terrible on both humanitarian and economic grounds. The extra $600 was supporting a huge amount of spending by people who now have to make drastic cuts. The spending made possible by the $600 was supporting 5.1 million jobs. Cutting that $600 means cutting those jobs—it means the workers who were providing the goods and services that UI recipients were spending that $600 on lose their jobs. The map in Figure B of this blog post shows how many jobs will be lost by state now that the $600 unemployment benefit has been allowed to expire. We will get August jobs numbers tomorrow morning, but as of July, we were 12.9 million jobs below where we were before the coronavirus hit, and the unemployment rate is higher than it ever was during the Great Recession. Now isn’t the time to cut benefits that support jobs.
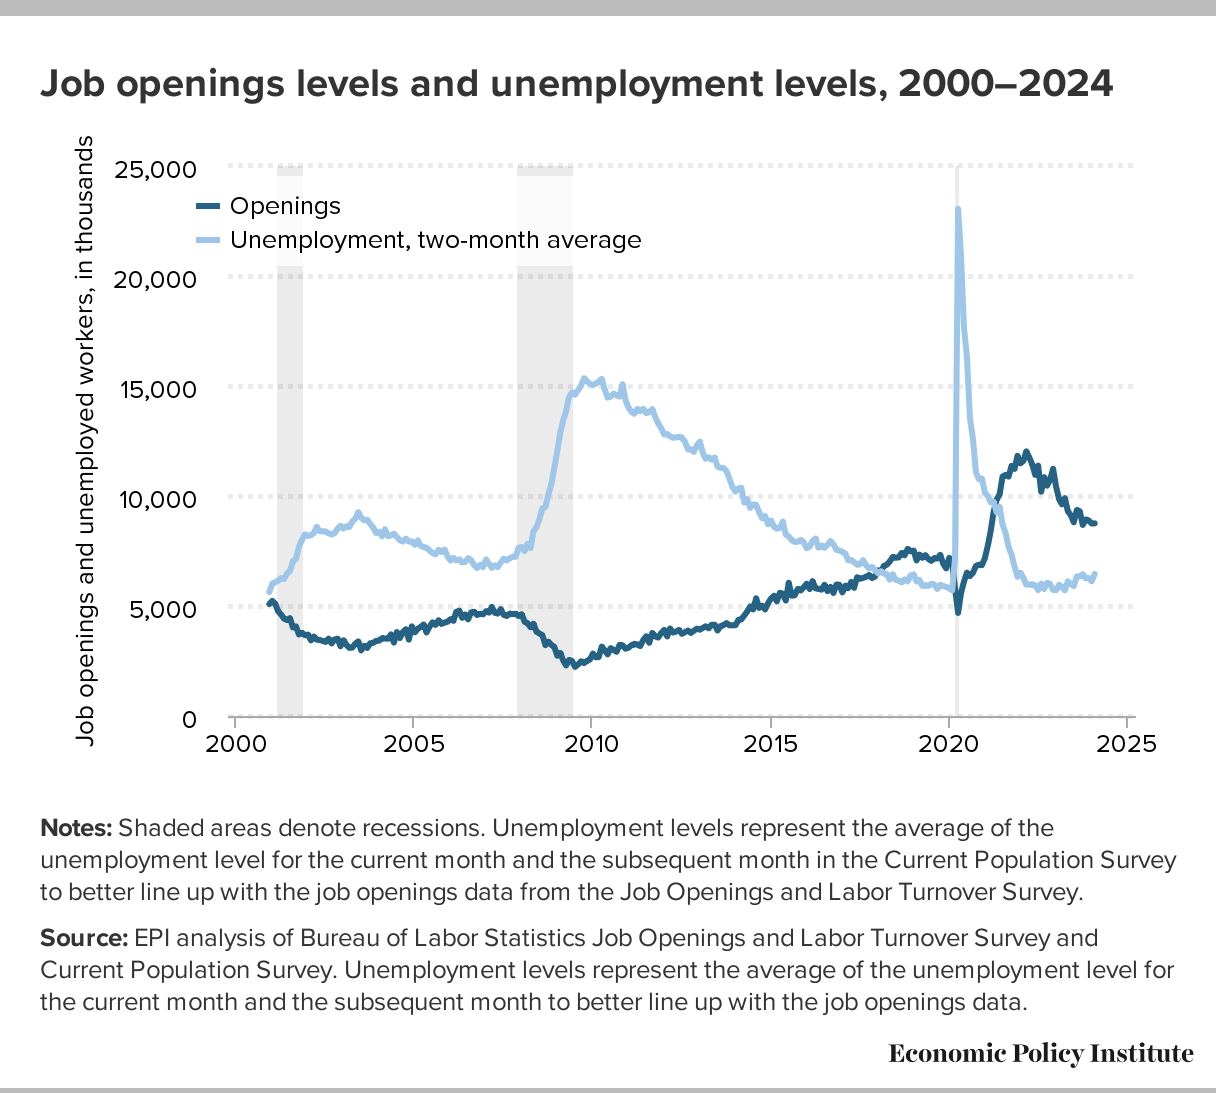
But what about the supposed work disincentive effect of the $600? Rigorous empirical studies show that any theoretical work disincentive effect of the $600 was so minor that it could not even be detected. For example, a study by Yale economists found no evidence that recipients of more generous benefits were less likely to return to work, which is what we would expect to see if the extra payments really were a disincentive to work. And a case in point: In May/June/July—with the $600 in place—9.3 million people went back to work, and a large share of likely UI recipients who returned to work were making more on UI than their prior wage. The extra benefits did not stop them from going back. A job offer is too important at a time like this to be traded for a temporary increase in benefits, and when commentators ignore that, they are ignoring the realities of the lives of working people. Further, there are 11.2 million more unemployed workers than job openings, meaning millions will remain jobless no matter what they do. Dropping the $600 cannot incentivize people to get jobs that are not there.
Dropping the $600 is also exacerbating racial inequality. Due to the impact of historic and current systemic racism, Black and brown communities have seen more job loss in this recession, and have less wealth to fall back on. They are taking a much bigger hit with the expiration of the $600. This is particularly true for Black and brown women and their families, because in this recession, these women have seen the largest job losses of all. The Senate must come back from vacation and extend the UI provisions of the CARES Act, both to provide relief to the jobless and to the bolster the broader economy.
Enjoyed this post?
Sign up for EPI's newsletter so you never miss our research and insights on ways to make the economy work better for everyone.