Rising inflation is a global problem: U.S. policy choices are not to blame
Key takeaways:
- An international comparison among OECD countries shows that rising inflation is a global phenomenon, not unique to the United States.
- This fact argues strongly that high inflation in the U.S. has not been driven by any unique American policy—not the American Rescue Plan and other generous fiscal relief during the pandemic recession and recovery nor anything else U.S.-centric.
- Some have argued that the global rise of inflation means that many countries— including the U.S.—overstimulated their economies and generated excess aggregate demand. But this explanation is not supported by the data. The countries with larger declines in unemployment over the past 18 months have not seen larger inflation spikes.
Consumer price data for June 2022 showed another month of rapid inflation, with overall inflation rising 9.1% year-over-year and core inflation (which doesn’t include volatile energy and food prices) rising by 5.9%. This level of inflation has obviously become a major political issue this year. But however this issue resonates politically, as an economic matter a common narrative that blames the Biden administration and its policy choices for causing the inflation is deeply misleading.
This is not simply a case for exonerating the Biden administration’s choices—how the recent inflationary outbreak is interpreted will have huge consequences for how policymakers respond. A loud chorus of economic analysts and influential policymakers continue highlighting the need for the Federal Reserve to continue raising interest rates sharply to slow growth to “rein in” inflation. This approach risks terrible consequences and threatens to cast aside the amazing policy achievement of a full jobs recovery from the pandemic recession.
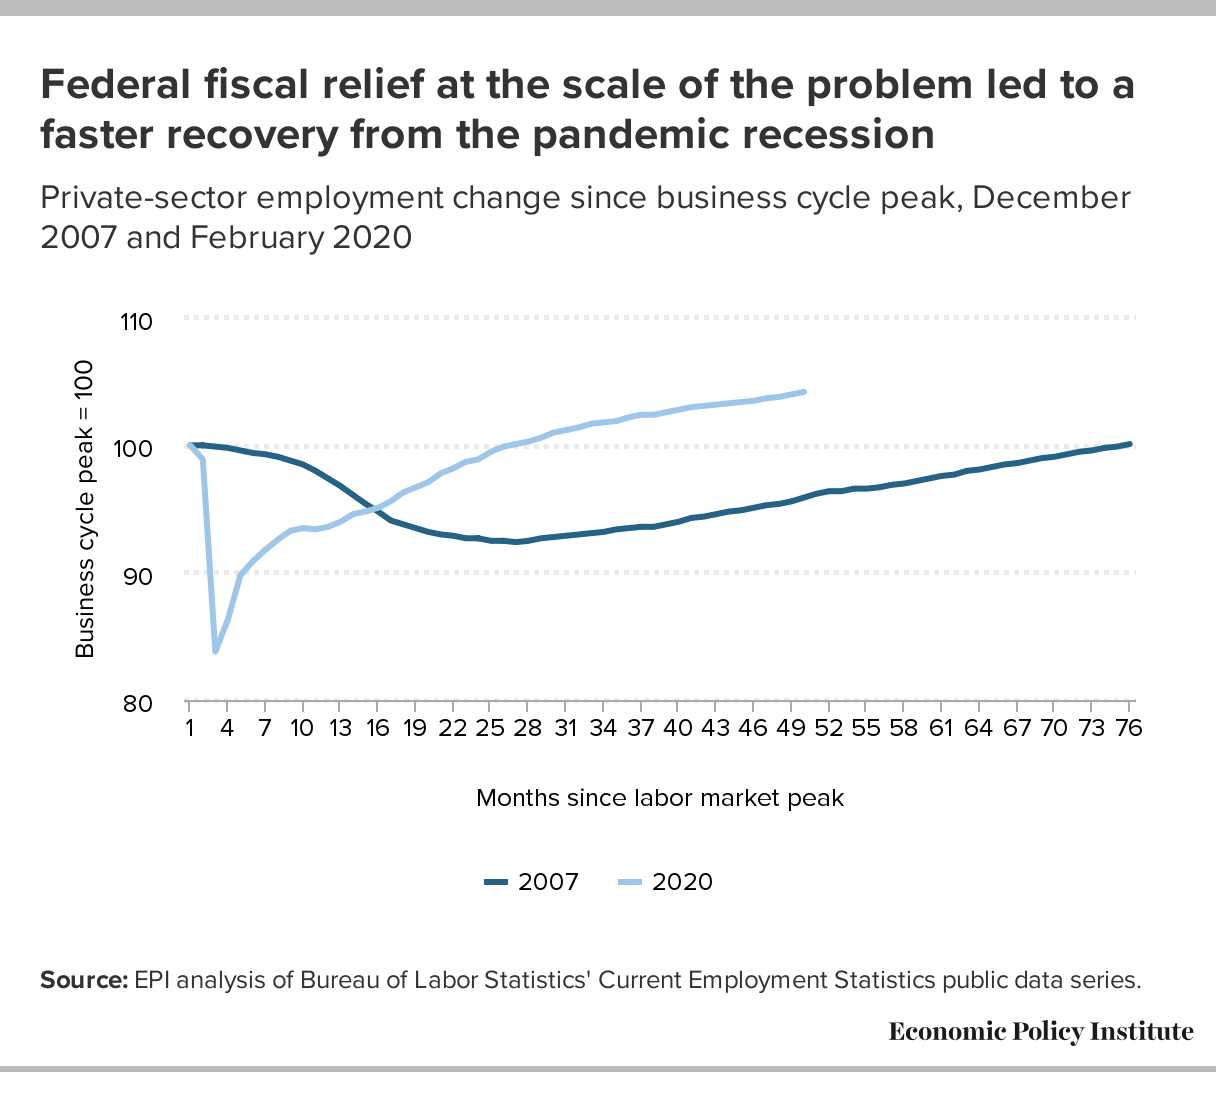
In the COVID-19 recession, the economy lost over 22 million jobs. But by June 2022 (after 28 months), the level of employment in the U.S. matched the last month pre-pandemic (February 2020). Compare this with job growth after the Great Recession of 2008-09, when it took more than six years (75 months) to regain the just under 9 million jobs lost and match pre-recession employment levels. The far faster recovery from the COVID-19 recession was significantly driven by a much more aggressive fiscal policy response.
This more aggressive fiscal response is often blamed for the inflation outbreak over the past 18 months. The most persuasive evidence casting doubt on this interpretation is a comparison of inflation between the U.S. and a large set of other rich countries that undertook a wide array of fiscal responses. Despite the different fiscal responses, essentially all of these countries have experienced a rapid acceleration of core inflation. This means that today’s inflation is not a uniquely U.S. problem, and therefore not connected to the necessary and effective economic policies that spearheaded the rapid economic recovery we see today.
In Figure A, we focus on core inflation (stripping out the prices of energy and food) because that is widely considered a better target for basing decisions about macroeconomic stabilization. Energy and food prices are not just volatile, they are also set on global markets, meaning that their price changes carry very little information about whether the U.S. economy specifically is currently experiencing macroeconomic imbalances. It’s also useful to highlight core inflation because much commentary has claimed that inflation in other advanced economies is overwhelmingly about energy and food prices, and far less about core prices. This claim is not supported by the data in Figure A.
As Figure A shows, all but one Organization for Economic Co-operation and Development (OECD) country saw an acceleration in core inflation. More significantly, this international comparison tells us that the U.S. is not an outlier in its experience with accelerating core inflation (the one obvious outlier in this data—Turkey—is currently experiencing inflation over 40% and is not included in the figure). The U.S. is on the higher side of inflation experiences, but far from the top and not that far above the average (or even the median) for all other OECD countries. The upshot of the figure is clear: A global phenomenon—accelerating inflation— demands a global explanation, and “Biden policies” obviously do not provide that.
The acceleration of inflation is global: Difference in core inflation rates from December 2020 to May 2022 compared with 2 years pre-pandemic “normal” inflation
| Country | Inflation acceleration |
|---|---|
| JPN | -0.0016 |
| NOR | 0.014173 |
| CHE | 0.01475 |
| NLD | 0.01691 |
| GRC | 0.01806 |
| FRA | 0.018085 |
| ITA | 0.019159 |
| MEX | 0.022772 |
| DEU | 0.023085 |
| BEL | 0.02426 |
| ESP | 0.024595 |
| KOR | 0.026003 |
| COL | 0.027358 |
| LUX | 0.02815 |
| ISR | 0.0285 |
| DNK | 0.030457 |
| AUT | 0.031292 |
| Non-US median | 0.031292 |
| CAN | 0.033041 |
| SWE | 0.033199 |
| FIN | 0.033758 |
| GBR | 0.03608 |
| IRL | 0.036566 |
| Non-US average | 0.036831 |
| USA | 0.038027 |
| SVN | 0.040865 |
| ISL | 0.042115 |
| LVA | 0.042944 |
| PRT | 0.051002 |
| HUN | 0.054954 |
| EST | 0.064302 |
| POL | 0.065441 |
| CHL | 0.065947 |
| LTU | 0.069453 |
| SVK | 0.076997 |
| CZE | 0.101539 |

Notes: We calculate inflation “acceleration” as post-pandemic inflation minus “normal” pre-pandemic inflation. Post-pandemic inflation is constructed as an annualized rate of change in core CPI from December 2020 to May 2022. Pre-pandemic “normal” inflation is constructed with 2018 and 2019 data for each country.
Source: Inflation data from the Organization for Economic Cooperation and Development (OECD).
Some have argued that the global rise in inflation is actually just evidence that the excess demand growth they see as driving inflation is also global. Of course, even this perspective provides some small bit of exoneration for American policymakers: if every advanced country in the entire world made similar policy decisions, then it seems hard to argue that the American approach was an avoidable mistake. But, another cut at the international data casts doubt on a simple story of macroeconomic imbalances driving the global inflation surge. Specifically, countries with larger declines in unemployment over the past 18 months have not seen larger inflation spikes.
In Figure B below, the vertical axis is the acceleration of core inflation relative to pre-pandemic trend that we showed previously in Figure A. On the horizontal axis, we subtract the average unemployment rate of March–May 2022 from the average unemployment rate that prevailed in 2018–2019. This can be taken as an indicator of how much unemployment has improved in a country in the recent period relative to pre-pandemic conditions. The higher the number on the horizontal axis, the lower is current unemployment relative to pre-pandemic averages. If one interprets unemployment that is lower today than pre-pandemic times as evidence of strong demand growth, one would expect to see a positive relationship between the improvement in unemployment (horizontal axis) and the acceleration of inflation (vertical axis). But there is no such significant relationship (in fact, there is a weak relationship the other way, with countries with higher unemployment relative to pre-pandemic times seeing higher inflation).
This finding should further complicate the claim that the “macroeconomic overheating” argument should simply be applied globally. And if there is not strong evidence that today’s global inflation is simply driven by excess global demand, the payoff to strongly reining in demand could be quite small, and the damage caused by this quite large.
Inflation acceleration is global, regardless of unemployment rates : Accelerated inflation and accelerated unemployment among OECD nations
| Country | Unemployment improvement | Inflation acceleration |
|---|---|---|
| AUT | 0.005583 | 0.031292 |
| BEL | 0.004167 | 0.02426 |
| CAN | 0.006292 | 0.033041 |
| CHL | -0.00345 | 0.01475 |
| COL | -0.01532 | 0.065947 |
| CRI | -0.02307 | 0.027358 |
| CZE | -0.00263 | 0.101539 |
| DEU | 0.002333 | 0.023085 |
| DNK | 0.004667 | 0.030457 |
| ESP | 0.014125 | 0.024595 |
| EST | -0.00567 | 0.064302 |
| FIN | 0.008167 | 0.033758 |
| FRA | 0.014917 | 0.018085 |
| GBR | 0.001542 | 0.03608 |
| HUN | 0.000375 | 0.054954 |
| IRL | 0.005083 | 0.036566 |
| ISL | -0.00129 | 0.042115 |
| ISR | 0.002024 | 0.0285 |
| ITA | 0.020292 | 0.019159 |
| JPN | -0.00171 | -0.0016 |
| KOR | 0.010917 | 0.026003 |
| LTU | 0.001333 | 0.069453 |
| LUX | 0.013417 | 0.02815 |
| LVA | 0.002458 | 0.042944 |
| MEX | 0.000871 | 0.022772 |
| NLD | 0.013833 | 0.01691 |
| NOR | 0.007792 | 0.014173 |
| POL | 0.009208 | 0.065441 |
| PRT | 0.009667 | 0.051002 |
| SVK | -0.00138 | 0.076997 |
| SVN | 0.008 | 0.040865 |
| SWE | -0.01021 | 0.033199 |
| USA | 0.010833 | 0.038027 |
Notes: We calculate inflation “acceleration” as post-pandemic inflation minus “normal” pre-pandemic inflation. Post-pandemic inflation is constructed as an annualized rate of change in core CPI from December 2020 to May 2022. Pre-pandemic “normal” inflation is constructed with 2018 and 2019 data for each country. We calculate accelerated unemployment in the same way.
Source: Inflation and unemployment data from the Organization for Economic Cooperation and Development (OECD).
Rather than the specific policies of the Biden administration driving inflation, the roots of today’s inflation are a more complicated cocktail of other forces: from the spike in raw material, energy, and commodities prices due in large part to the Russian invasion of Ukraine, to lingering supply chain disruptions and distorted consumer demand patterns stemming from the pandemic. These shocks and their unexpectedly large ripple effects are the global explanation for rising inflation.
Again, this is not an academic exercise or simply providing political cover for any particular policymaker. Instead, there is real economic danger from misdiagnosing the inflation problem. An engineered, unnecessary recession will only cause more economic pain to those still just recovering from the COVID-19 recession, and will undercut the strong economic recovery underway.
Enjoyed this post?
Sign up for EPI's newsletter so you never miss our research and insights on ways to make the economy work better for everyone.