Easily Sharable Minimum Wage Graphics
In a speech today outlining his economic agenda for the next two-and-a-half years, President Obama repeated his call for raising the minimum wage.
At the same time, today was a national day of action in support of a higher minimum wage. Americans throughout the country rallied to support legislation that would raise the minimum wage to $10.10 per hour and index it to inflation.
EPI has long supported raising the minimum wage, and it’s great to see the president, lawmakers and activists making the case for a minimum wage increase. Raising the minimum wage would boost the incomes of millions of Americans, provide a modest economic stimulus, and slow the growth of income inequality.
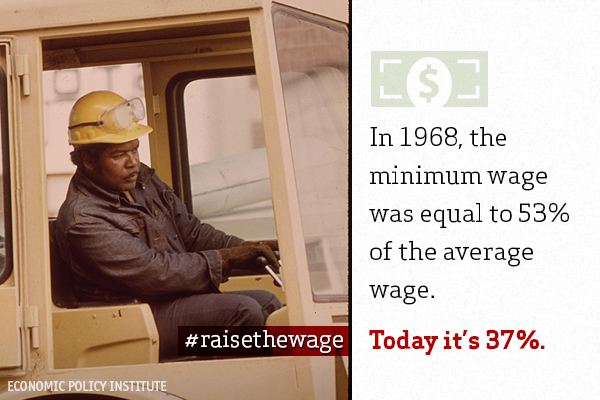
The inflation-adjusted value of the minimum wage is lower today than it was in 1968. If the value of the minimum wage had kept pace with average wages since then, it would be $10.50 today. If it had increased alongside productivity, it would be $18.75 today. And if it had increased at the same rate as the wages of the top 1.0 percent, it would be over $28 per hour.
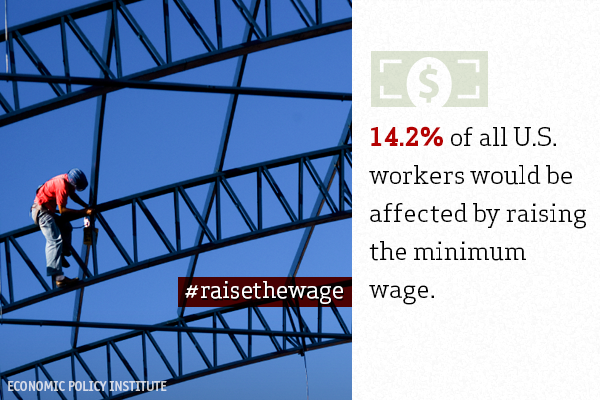
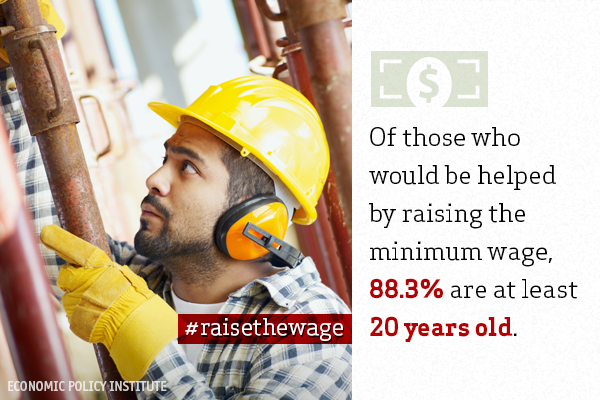
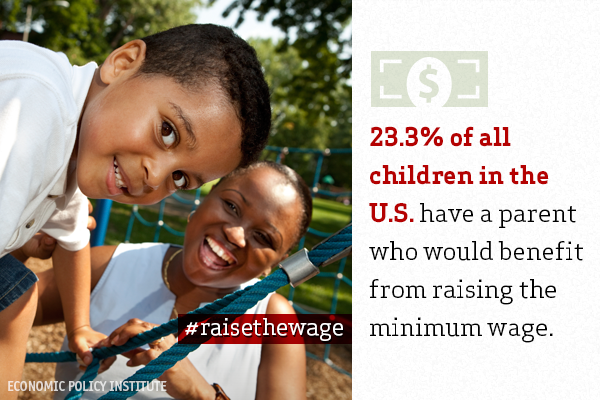
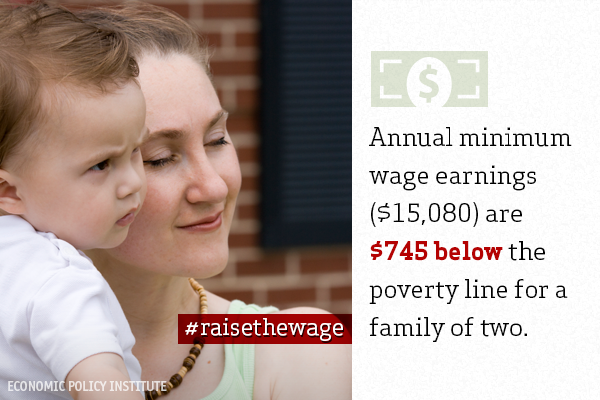
In support of the national day of action, we made a series of graphics with facts about who would be affected by a minimum wage increase, and why it’s a good idea. They’re quick, to the point and easily shareable. The data points come from this paper. Check them out:


Enjoyed this post?
Sign up for EPI's newsletter so you never miss our research and insights on ways to make the economy work better for everyone.