Opinion pieces and speeches by EPI staff and associates.
[ THIS TESTIMONY WAS GIVEN BEFORE U.S. CONGRESS’ JOINT ECONOMIC COMMITTEE ON MARCH 7, 2008. ]
If the Economy’s so Bad, Why Is the Unemployment Rate so Low?
By Rebecca M. Blank
Chairman Schumer, Ranking Member Saxton, and distinguished members of the Committee, I appreciate the opportunity to appear before you today to discuss the labor market. The opinions I will express are my own and not those of the organizations with which I am affiliated.
The unemployment rate has long been used as a common measure of ‘economic pain’ in the economy. Today, I want to analyze the current labor market situation, with particularly attention to unemployment.
There is much current talk about recession and a wide variety of economic indicators are signaling a major economic slowdown. GDP growth was below 1% last quarter; credit is tight, even with lower interest rates; and consumer confidence is falling. This has generated a conversation about whether the federal government should extend Unemployment Insurance benefits beyond their standard 26 weeks.
Yet, the unemployment rate has remained relatively low in recent months, at or below 5%. At least compared with unemployment in the 1970s and 1980s, this does not seem high and is below the unemployment rate where extended benefits were implemented in the past. I want to argue that this low unemployment rate is somewhat misleading, because the composition of those in the labor market is different than in the past. In fact, there is substantial evidence that the problems of unemployment are at least as bad now as they were at the beginning of the economic slowdown of the early 1990s or the early 2000s, both recessions when extended benefits were enacted.
Current Labor Market Indicators
There are at least five indicators of problems in the current labor market.
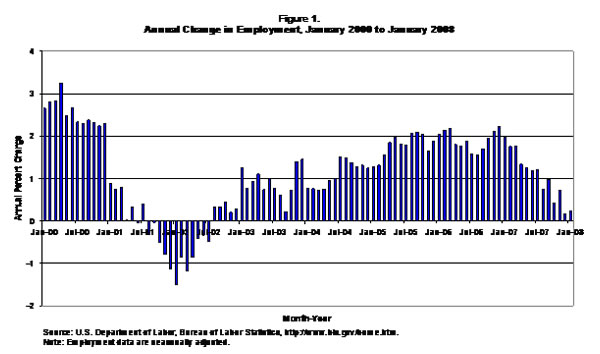
First, recent months have shown a marked slowdown in employment growth. From January 2006 through January 2007, employment grew by 2%. Over this past year, from January 2007 through January 2008, employment grew only 0.2%. The number of people employed has actually declined in a few recent months. Figure 1 shows the annual changes in unemployment from month to month; the recent slowdown in employment growth is clearly visible over the past year.
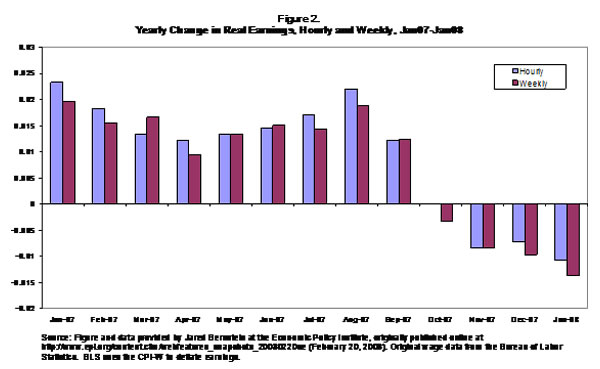
Second, wage growth has slowed over the last six months. Figure 2, taken from a chart constructed by Jared Bernstein at the Economic Policy Institute (Bernstein, 2008), indicates that the annual change in real earnings has been negative since October. This is due to the combination of very slow growth in nominal wages and faster inflation, leading to a decline in real (inflation-adjusted) wages.
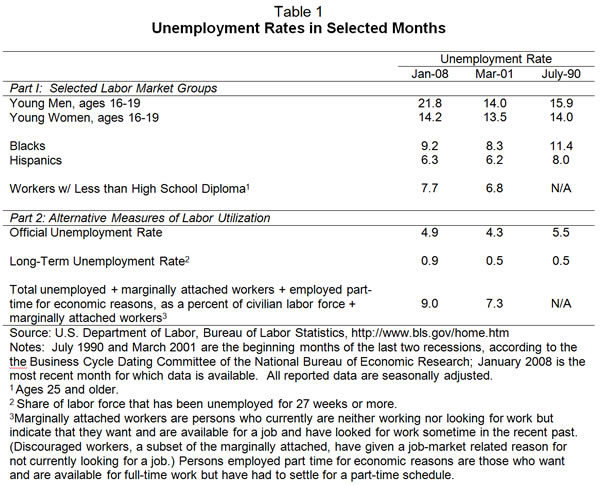
Third, unemployment is at relatively high levels among high-risk groups. Table 1 compares unemployment rates in January 2008 with unemployment in July 1990 and March 2001. These were the months that marked the official beginning of the recessions of the early 1990s and the early 2000s. While I do not know if January 2008 was the first month of a recession, it is interesting to compare unemployment in January 2008 to unemployment at the beginning of historical economic slowdowns. The top part of Table 1 shows unemployment rates among groups that we tend to think are most at risk of job loss and long-term unemployment in times of recession.
The evidence suggests that unemployment in January 2008 was higher among younger workers than at the beginning of the 1990 or the 2001 recessions. It was higher among less skilled workers than in 2001 (we only have data on this from the mid-1990s onward), and higher among black and Hispanic workers than in 2001, but lower than in 1990.
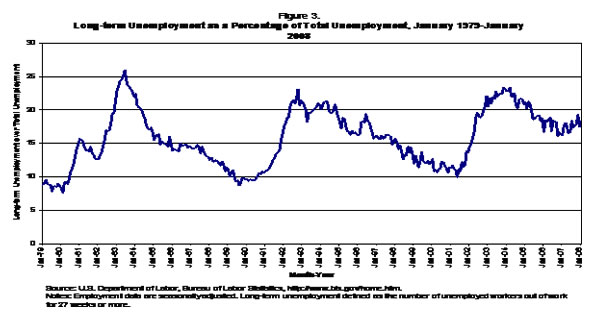
Fourth, indicators of labor market slackness are at high levels. The bottom part of Table 1 shows three alternative measures of labor market slackness. Overall unemployment rates are higher now than at the beginning of the 2001 recession, but slightly lower than at the beginning of the 1990 recession. Long-term unemployment measures the number of workers whose unemployment spell has lasted 27 weeks or longer. Long-term unemployment is currently quite high, with almost 1% of the workforce in long-term unemployment in January 2008.
Figure 3 shows long-term unemployment as a share of overall unemployment. As of January 2008, 18.3% of the unemployed had been unemployed for more than a half year. This is substantially higher than in 1990 (at 12.9%) or 2001 (at 11.1%). This suggests that a substantial fraction of those who lost jobs in 2007 are having serious difficulties finding reemployment.
The standard unemployment rate measures those who actively looked for work. The Bureau of Labor Statistics also computes a measure of those they call “marginally attached,” which are those who want a job and have recently looked for a job, but are currently not looking because jobs are so scarce. They also measure those who are working only part-time because of economic reasons, the so-called ‘involuntary part-time workers.’ If one expands the labor force to include marginally attached workers, and looks at the share who report themselves as either unemployed, marginally attached, or involuntarily working part-time, this is 9% of the labor force in January 2008 (shown at the bottom of Table 1). In March 2001, the beginning of the last recession, this number was only 7.3%.
Fifth and finally, coming from Michigan, I have to note that some parts of the country are clearly in recession, even if we are still arguing about whether there is a national recession. Michigan’s unemployment rate was 7.6% at the end of 2007. Seven states had unemployment rates over 6%. In these parts of the country, jobs are scarce and unemployment is a clear economic and social problem.
Why is the Aggregate Unemployment Rate So Low?
This leads back to our starting question: If the labor market problems are so bad, why is the overall unemployment rate so low?
Most important is the shifting age distribution of the civilian labor force. As the baby boom generation has aged, the share of workers in older age groups has steadily grown, while the share in younger age groups has fallen. This has the effect of lowering the overall unemployment rate because older workers tend to have lower unemployment rates. Columns 1 through 3 of Table 2 show the unemployment rate by age group in July 1990, March 2001 and January 2008. Columns 4 through 6 show how the share of workers within each age group has shifted over this time period. There is a steady growth in the share of older workers and a decline in the share of younger workers.
It is apparent from Table 2 that unemployment is higher among every age group of worker in January 2008 compared to March 2001, and higher among most groups compared to July 1990, even though overall unemployment is lower. This is because the weights across the age groups have shifted.
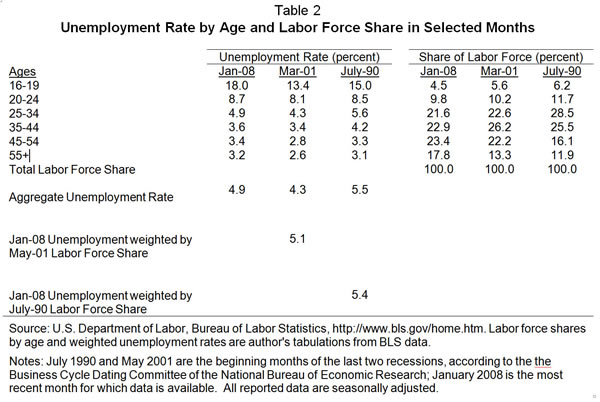
If you take the age-spe
cific unemployment rates in January 2008 and weight them as if the labor force looked as it did in July 1990, the unemployment rate in 2008 would be 5.4% rather than 4.9%, very close to the actual unemployment rate of 5.5% in July 1990. Similarly, the January 2008 unemployment rate would be 5.1% if age groups are weighted by the March 2001 labor force weights, far above the actual March 2001 unemployment rate of 4.3%.
In short, the shifting age distribution in the population should change our expectation about what constitutes low versus high unemployment. Because older workers have lower unemployment rates, base unemployment rates have fallen with an aging workforce. Hence, the same unemployment rate in January 2008 signals more problems than it would have in early 1990 or even in early 2001. From the point of view of any worker who compares herself to her age peers, unemployment is worse now than at those earlier moments in time.
There is another effect depressing unemployment rates, and that is the rising share of younger men in jail or prison. I suspect most of you saw the report from the Pew Foundation last week noting that 1 out of every 100 adult Americans are now in prison (Pew Center on the States, 2008). Our labor force statistics are based on civilian non-institutionalized persons. Those in prison are not counted. This particularly affects younger men. Of course, the civilian labor force data also excludes those in the Armed Forces, all of whom are employed. This also disproportionately affects younger men.
Rather than working with the civilian noninstitutionalized population, I add Armed Forces personnel and those in jails and prisons to the population numbers and add Armed Forces personnel to the employment numbers. I do this calculation for 2006, the latest year for which all these data are available.
It has hard to calculate an adjusted unemployment rate because we are not sure how many men currently in prison would be actively seeking work. For a back-of-the-envelope calculation, I assume that 80% of those in prison would be in the workforce if they were not in prison, and that the unemployment rate among these men would be 25%. (This is only slightly higher than the current 21% unemployment rate among young men ages 16-19.) Under these circumstances, the 2006 male unemployment rate would rise from its reported level of 4.6% to 4.9%.
Of course, most of the men in prison or in the Armed Forces are younger. If I assume that all of these men are between the ages of 16 and 34, I can look at the effect on employment-to-population ratios and on the unemployment rate for that group in the population. Taking account of both the Armed Forces and the large number of men in prisons or jails, the 2006 employment-to-population ratio among men ages 16-34 would fall from 72.3% to 69.5%. Their unemployment rate would rise from its reported 2006 level of 7.2% to an estimated 7.8%.
In short, by expanding the prison population, we have removed more and more young men from our labor market count. This reduces aggregate unemployment rates and raises employment shares, since these are often persons who would have difficulty finding jobs if they were not in prison.
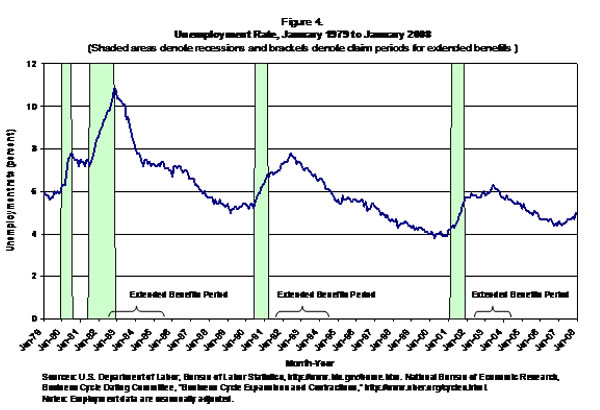
Finally, if we want to understand why unemployment rates look low right now, there is one more very important comment to make: Unemployment rates and employment changes are lagging indicators of an economic slowdown. Unemployment rates are typically low at the point a recession begins. They rise during a recession and often peak after a recession has ended. Hence, unemployment rates are NOT a good indicator of whether an economy has entered a recession. Figure 4 plots unemployment rates over the past 25 years. The shaded areas indicate periods of recession. In every recession, unemployment rates are low in the first month, and often peak after the end of a recession.
Because unemployment rises slowly, the political impetus to enact extended benefit legislation often occurs later in a recession, once unemployment rates are higher. Figure 4 indicates that extended benefits have been enacted quite late in past recessions. In fact, in both the early 1990s and the early 2000s, extended benefits were enacted after the official end of the recession (but at a time when unemployment rates were still rising.)
If you believe the U.S. economy is entering a serious economic slowdown, unemployment rates are likely to increase steadily in the months ahead. Should we enact extended benefits now or, as in past recessions, wait for the unemployment rate to rise further? Even adjusting for population shifts, the unemployment rate is still lower than it was when extended benefits were put in place in past years. This might argue for waiting. On the other hand, the unusually high rates of long-term unemployment in the current economy suggest that a growing share of the unemployed who receive unemployment benefits will exhaust them without finding a job. This argues for moving faster. Extended benefits can particularly assist long-term unemployed workers who are having difficulty finding jobs. Certainly waiting until after a recession has ended to enact extended benefits (as we’ve done in the recent past) makes little sense. Personally, I would recommend enacted extended benefits now, given the high rate of long-term unemployment among the jobless.
That said, I cannot end this discussion without a very important caveat. Unemployment Insurance (UI) is received by a minority of the unemployed and the share receiving UI has been falling in recent years. Only 34% of the unemployed received UI at the end of 2007 (U.S. Department of Labor, 2007). For many of the unemployed, extended UI benefits will have little effect on their economic situation. While a recession in the next few months might increase the call for extended benefits, in the longer run, reform of the entire UI program is necessary if you want more unemployed workers to have access to an economic cushion when they lose their jobs.
Conclusions
Simply comparing unemployment rates in early 2008 with those in past years can be misleading. Our expectations about labor market measures should change over time, as the overall population ages. An aging population typically means lower aggregate unemployment rates because older workers (that is, persons in their 40s and 50s, not persons in their 60s) tend to be more stably employed. (This is also one reason why current labor force participation rates are high.) Hence, while aggregate unemployment rates are low, unemployment among each age group is higher than it was at the beginning of the 2001 recession.
Lower unemployment rates among younger men are also explained by who we count in the labor force. A growing share of younger men who would have been in the labor force in earlier years is in prison in 2008. This also reduces the overall unemployment rate since these men would have had higher unemployment rates if they were not incarcerated.
Only time will tell if an economic slowdown leads unemployment rates to rise rapidly over the next several months. As with the rest of the economy, however, at this point in time there are a number of warning signals in the labor market. The pattern of slower employment growth and rising unemployment rates, seen in Figures 1 and 4, looks a great deal like the beginning-of-recession periods in the recent past. I am particularly struck by the very high share of long-term unemployed and the high number of people who are discouraged or involuntarily employed only part-time. For those who are actively seeking work, the search is likely to be long in the current economic environment.
References
Bernstein, Jared. 2008. “Real wage reversal persists.” Economic Snapshots. Washington, D.C.: Economic Policy Institute. February 20. Available at href=”http://www.epi.org/content.cfm/webfeatures_snapshots_20080220se”>http://www.epi.org/content.cfm/webfeatures_snapshots_20080220se.
Pew Center on the States. 2008. One in 100: Behind Bars in America 2008. Washington, D.C.: Pew Charitable Trusts. February. Available at http://www.pewcenteronthestates.org/uploadedFiles/One in 100.pdf.
U.S. Department of Labor, Employment and Training Administration. Unemployment Insurance Data Summary. 3rd Quarter 2007. Washington, D.C.: U.S. Department of Labor. Available at http://workforcesecurity.doleta.gov/unemploy/content/data.asp.
Rebecca Blank is the Henry Carter Adams Professor of Public Policy and Professor of Economics, University of Michigan, where she also serves as co-director of the National Poverty Center. She is currently on leave as the Robert V. Kerr Visiting Fellow at Brookings Institution in Washington, D.C. The views expressed in this testimony reflect her opinions and not those of any of the organizations with which she is affiliated.
[ POSTED TO VIEWPOINTS ON MARCH 7, 2008. ]
