Opinion pieces and speeches by EPI staff and associates.
[ THIS TESTIMONY WAS GIVEN BEFORE THE U.S. HOUSE SUBCOMMITTEE ON WORKFORCE EMPOWERMENT AND GOVERNMENT PROGRAMS ON APRIL 29, 2004. ]
Minimum Wage and Its Effects on Small Business
I sincerely thank the members of the committee for the opportunity to testify on this issue of great importance to working families.
As members of this panel are well aware, the federal minimum wage was introduced in the Fair Labor Standards Act of 1938. At that time, and many times since, Congress has recognized the need for a policy that prevents market forces from driving the wage of our lowest paid workers below a level deemed to be minimal by Congress, and by our general sense of fairness and decency. Since it is not indexed to inflation, the buying power of the minimum wage declines unless our nation’s leaders enact an increase. Thankfully, numerous proposals to raise the minimum are currently under consideration and I speak to these specific proposals below.
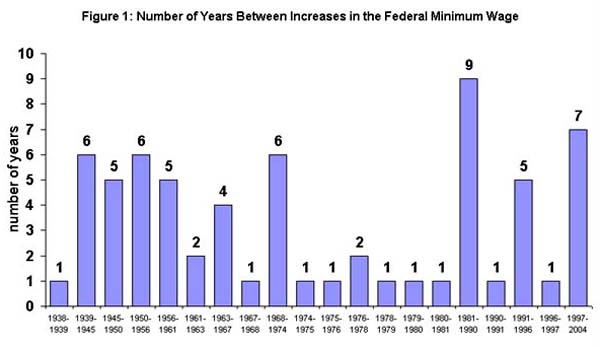
It is not widely recognized that we as a nation are on track to tie the longest period over which Congress has failed to enact an increase in the minimum wage. As shown in Figure 1, the minimum was ignored for nine years over the 1980s, until President George H. Bush signed an increase in 1990. The next increase came under President Clinton in 1996, with bi-partisan support from a Republican-majority Congress. Thus, while increasing the minimum wage is often a divisive issue, it is instructive to note that partisans have historically worked together to ensure that the lowest paid among us are not wholly subject to the vicissitudes of the marketplace. As the figure shows, the current period is the second longest on record without an increase.
The rest of my statement will be devoted to an explanation as to why an increase in the minimum wage is needed with an emphasis on empirical research of the impact of past increases. I will also emphasize the experience of small businesses with respect to minimum wage increases.
The Decline in the Real and Relative Values of the Minimum Wage
Figure 2: Federal Minimum Wage, 1947-2004, Adjusted for Inflation
• The real minimum wage is 30% below its peak level in 1968, and 14% below its 1997 level, when it was last increased.
• The inflation that has occurred since the last increase (passed in 1996) has now fully eroded the value of that increase. In 2004 dollars, the 1995 minimum wage was $5.19 compared to $5.15 today 1.
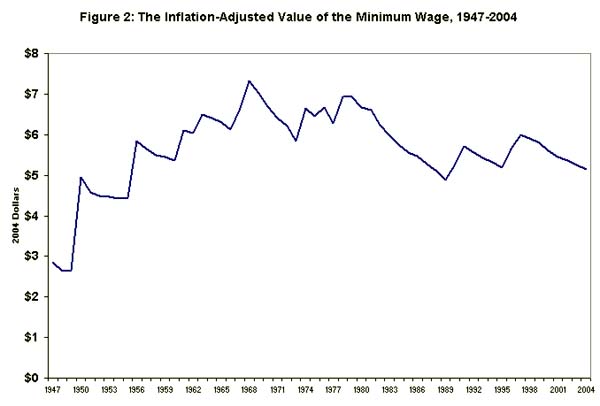
Figure 3: Federal Minimum Wage Relative to Average Wage, 1947-2004
• In 2004, the minimum wage relative to the average wage was 33%, the lowest value since 1949 2.
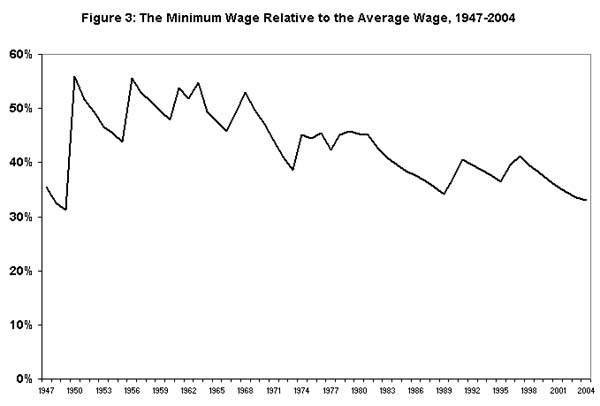
This figure gives an indication as to how far the minimum wage has drifted below the average earnings of production workers in manufacturing and non-supervisors in services. The decline suggests a growing distance between average and low-wage workers and is thus one reason for the growth of economic inequality over the past few decades.
The Share of Workers Affected by Various Proposals
As noted, both Senate Democrats and Republicans may soon introduce proposals to increase the minimum wage. Figure 4 shows our estimates of the number and share of workers affected by the actual 1996-97 increase, from $4.25 to $5.15, along with projected estimates of two different proposals currently under discussion (both assume an April 2006 phase-in). The bars represent the number and share of workers earnings between the old and new minimum wage. This value is possibly the single most important variable when evaluating the benefits of a minimum wage proposal to low-wage workers as well as the potential costs to employers.
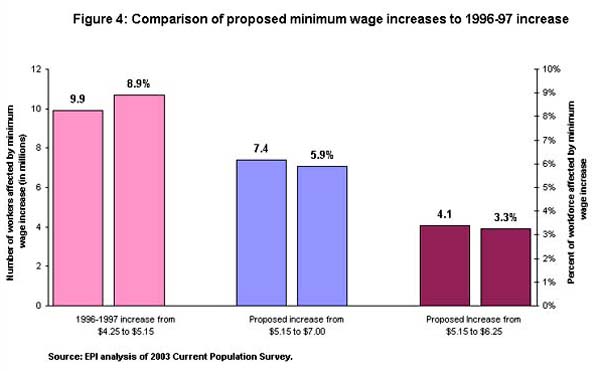
The last minimum wage increase in 1996-1997 increased the earnings of 9.9 million workers, or 8.9% of the workforce. By this metric, the current proposals are significantly more modest. The larger increase, to $7—this is the expected Senate Democrat proposal—would raise the wages of 7.4 million workers, or 5.9% of the workforce, whereas the expected Senate Republican offer—$6.25—would reach 4.1 million workers, or 3.3% of the workforce. In all cases, the demographic groups who disproportionately benefit from these increases are adults, women, and minorities.
Employment Outcomes: Does the Minimum Wage Hurt Small Businesses?
Despite the fact that contemporary economic research casts a long shadow of doubt on the contention that moderate minimum wage increases cause job losses, opponents still lead with this argument. This so-called “disemployment” argument is particularly difficult to maintain given two relatively recent developments in the history of minimum wages. First, the quality of empirical minimum wage research rose steeply over the last decade, due largely to economists’ ability to conduct pseudo-experiments 3. Such experiments, rare in empirical economics, typically utilize the fact that numerous states (12 as of today) have raised their minimum wage above that of the federal level. This variation between states gives researchers a chance to isolate the impact of the wage change and test its impact on employment and other relevant outcomes. As stressed in the Card and Krueger book cited above, these studies reveal employment elasticities that hover about zero, i.e., they solidly reject the conventional hypothesis that any increase in the minimum wage leads to job losses among affected workers.
Second, following the most recent increase legislated in 1996, the low-wage labor market performed better than it had in decades. The fact that the employment and earnings opportunities of low-wage workers grew so quickly following that increase continues to pose a daunting challenge to those who still maintain that minimum wage increases hurt their intended beneficiaries.
Recently, the Fiscal Policy Institute (FPI) released a study of the impact of higher minimum wages on small businesses 4. Their analysis focuses on various outcomes for businesses with less than 50 employees, comparing these outcomes between states with minimum wages above the Federal level and those at the Federal level. If the theory that higher minimum wages hurt smal
l businesses is correct, then we would expect there to be less growth in such enterprises in states with higher minimum wages. In fact, as shown in Figure 5, the opposite is the case.
• Between 1998 and 2001, the number of small business establishments grew twice as quickly in states with higher minimum wages (3.1% vs. 1.6%).
• Employment grew 1.5% more quickly in high minimum wage states.
• Annual and average payroll growth was also faster in higher minimum wage states.
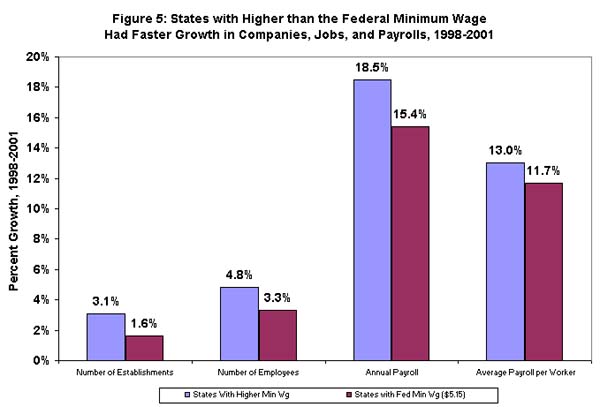
FPI presents similar results for small businesses in the retail sector.
In related research, Waltman, et al. (1998) examine the relationship between business failures and minimum wage increases 5. Here again, claims by business-community opponents of the minimum wage suggest that business failures should increase along with minimum wage increases. But in examining this relationship over more than 30 years, Waltman et al conclude that:
“…there seems to be no discernible correlation between minimum wage increases and a rise in business failures, either in the year the increase occurred or in the following year. If anything, the evidence leans the other way” (page 221).
The Minimum Wage and Family Income
Opponents of minimum wage increases often criticize its “target efficiency.” Since receipt of the minimum wage is not tied to income, critics argue, some of the beneficiaries of the increase are likely to reside in high-income families, and thus don’t really need the extra income. In fact, as shown in Figure 6, the gains from a minimum wage increase flow largely to those in the bottom third of the income scale 6.
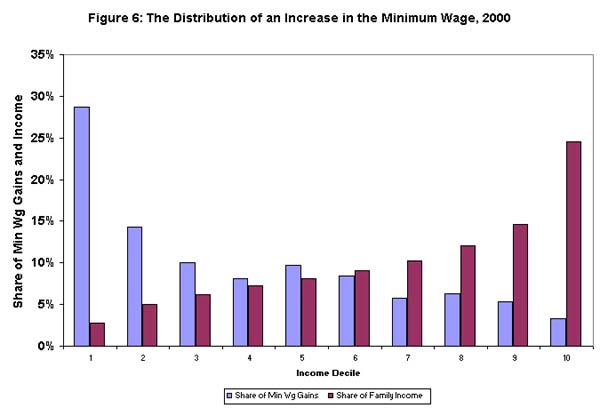
The figure shows the share of gains from a simulated $1.00 increase in the minimum wage in the year 2000, by income decile. It also shows the distribution of income by decile, allowing a comparison between the distribution of the wage increase to the distribution of income. The distribution of both variables is highly skewed in opposite directions. Family income, as is well-known, is concentrated at the top. The top 10% of families, for example, with an average income of $181,000 in 2000, held 25% of income that year. Their share of the minimum wage increase was 3.4%.
Conversely, at the low end of the income scale, families in the bottom decile—average income, $11,700, received 28.7% of the gains from a minimum wage increase and 2.8% of income. Summing the bottom three quintiles, we see that over half—53%—of the gains from the increase flow to families in the bottom 30% of the income scale, compared to an income share of 14%. The distribution of the minimum wage increase is clearly progressive, especially compared to that of income.
Nevertheless, the figure does reveal that since the minimum wage is not tied to income, some of the benefits from the increase flow to wealthy families. This by no means invalidates the policy, which is intended to set a minimum wage floor for all workers, regardless of family background. However, this result has led some who oppose the minimum wage to argue the Earned Income Tax Credit, the receipt of which is directly linked to family income, is a better policy for low-wage workers.
While the EITC is surely a very important income source for low-wage workers in low-income families, there are a number of reasons to discount the notion that its existence obviates the need for an increase in the minimum wage.
• The policy under discussion is an increase in the minimum wage. Simply citing the existence of the EITC has little relevance if the goal is an increase in the incomes of low-wage workers. To be logically consistent, those who cite the EITC as a reason not to raise the minimum wage must advocate for an increase in the tax credit.
• Increasing the EITC has fiscal budgetary costs that must be considered when invoking this policy. The minimum wage does not carry such costs.
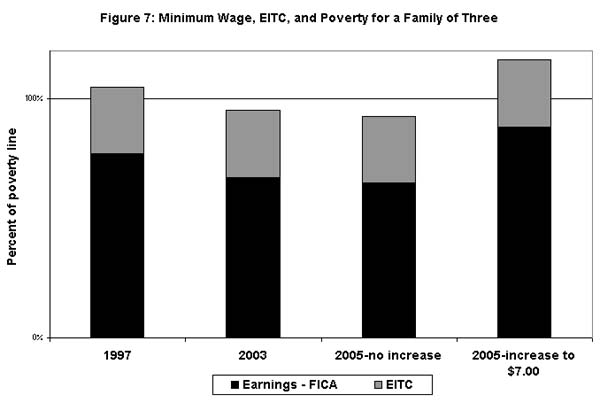
• As shown in the next figure, the two—EITC and minimum wages—are complements, not substitutes.
Figure 7 is a simulation of the interaction of the minimum wage, FICA taxes, and the EITC for a full-time working parent with two children. In 1997, after the last minimum wage increase, full-time work at the minimum, along with the EITC, put this family above the poverty line (~$14,800 in 2003). The inflation-induced erosion of the minimum wage by 2003 has meant that even with the EITC (the tax credit is indexed), this single parent is once again below the poverty line, and he/she of course falls further behind by 2005. However, were the minimum wage increased to $7 by 2005, the family would be back above the poverty line. Such analysis reveals the complementary nature of the two policies.
Conclusion
Since the late 1930s, the Federal government has recognized the need for a national wage floor: a minimum wage level below which Congress will not allow wage offers to fall. Unless Congress acts, however, the value of this wage floor will fall behind both inflation and the general upward trend in living standards. In fact, as shown in Figure 1, we are in the midst of the second longest stretch in which Congress and the administration have failed to enact an increase in the minimum wage.
Two proposals are under debate, and I show above that both would cover fewer workers than the last increase enacted in 1996. In this regard, it is notable that following that last increase, low-wage workers faced an all-too-unique period of fast growing employment and earnings opportunities. Evidence presented above, along with much empirical labor economic analysis of this issue, reveal that such moderate increases as those that may soon be under consideration in the Senate have no measurable negative impacts on jobs. In addition, the gains from the increase will largely accrue to those in the bottom third of the income scale. With these empirical facts on the record, Congress should act quickly to raise the wage floor in support of our lowest paid workers.
Notes
1 In order to put past values in 2004 dollars, I use the most recent (April 10, 2004) Blue Chip forecast of inflation for 2004: 1.9%.
2 The average wage is the Bureau of Labor Statistics series for production, non-supervisory workers. The 2004 value comes from aging the annual 2003 level by the growth rate of the average wage between the 2003q1 and 2004q1.
3 See, for example, David Card and Alan Krueger. 1995. Myth and Measurement: The New Economics of the Minimum Wage. Princeton, N.J.: Princeton University Press.
4 “State Minimum Wages and Employment in Small Businesses,” Fiscal Policy Institute, April 20, 2004. www.fiscalpolicy.org.
5 See Jerold Waltman, Allan McBride, and Nicole Camhout, “Minimum Wage Increases and the Business Failure Rate,” Journal of Economic Issues, Vol. XXXII, No.1, March 1998.
6 The source for the figure is author’s analysis of March Current Population Survey data. Non-working families are excluded, and minimum wage gains, which are based on hourly wages reported in March of the survey year, are summed across families.
Jared Bernstein is senior economist at the Economic Policy Institute in Washington, D.C.