See Snapshots archive.
Snapshot for January 16, 2008.
Rich man, poor man: The life expectancy gap
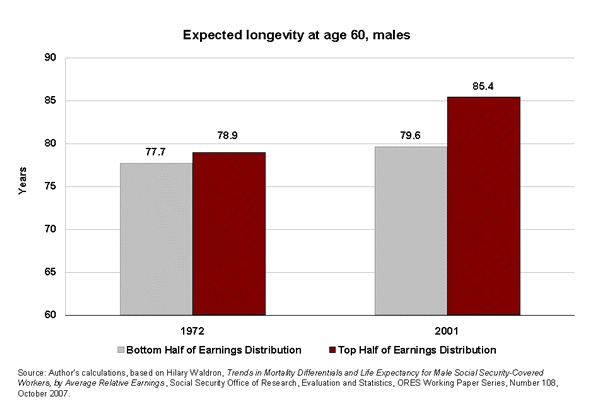
New research on Social Security-covered males1 indicates that the increase in longevity for older participants occurred mostly among those in the top half of the earnings distribution.
Over the past century, life expectancy at birth increased dramatically, from 49 years for an American baby born in 1900, to 64 for one born in 1940, and 77 for one born in 2003, according to the Centers for Disease Control and Prevention. Much of this increase reflects a drop in infant mortality and other childhood factors that do not affect retirement. But life expectancy also increased for older Americans, fueling calls for another increase in the Social Security retirement age. (Social Security reforms instituted in 1983 phased in an increase in the full retirement age from 65 to 67 over a 22-year period beginning in 2000.)
But the increase in longevity is not balanced across the income ladder. According to a new working paper by Hilary Waldron of the Social Security Administration, a male in the top half of the earnings distribution who turned 60 in 1972 could expect to live 1.2 years longer than one in the bottom half. By 2001, the gap had grown to 5.8 years (see Chart).2
Other research cited by the author suggests that the widening of such socioeconomic differences—a phenomenon not observed in neighboring Canada, which has universal health care coverage—is at least partly explained by disparities in treatment for heart disease and cancer. As inequality in America worsens, we can expect this longevity gap between the rich and poor to grow even wider.
Notes
1. Researchers often focus on males because the increase in women’s work force participation has affected the composition of the female workforce.
2. These findings are likely to understate the difference between the two groups because the sample was restricted to workers with positive earnings between 45 and 55.

