August 28, 2007
Poverty, income, and health insurance trends in 2006
by Jared Bernstein, Elise Gould, and Lawrence Mishel
Reflecting the fifth year of an economic expansion, the percent of the nation in poverty fell last year, and the income of the median household grew (after inflation) by about $360, or just under one percent (0.7%), according to data released today by the U.S. Bureau of the Census. This is the second year of real income gains for the median household, and the first significant decline in poverty since 2000.
While both poverty and income have improved over the last few years, it is disappointing that despite low unemployment and strong productivity growth, these measures of living standards have yet to recover to their levels of the previous business cycle peak in 2000. In that year poverty was 11.3%, compared to 12.3% in 2006, an increase in the poverty rolls of 4.9 million persons, including 1.2 million children; median household income in 2006 was $48,201, about $1,000 dollars (-2.0 %) below its 2000 level (in 2006 dollars). In other words, economic growth over the last six years has totally bypassed the typical middle-class household.
One negative trend persists: The share of Americans without health insurance coverage once again increased, from 15.3% in 2005 to 15.8% last year. There were 47.0 million uninsured Americans in 2006, up 2.2 million since its 44.8 million level in 2005. Since 2000, the share of the population without health coverage has increased 2.1 percentage points, an increase of 8.6 million uninsured Americans.
Earnings of full-time workers
Reflecting the narrow extent to which the growing economy has been showing up in the paychecks of many working-age households, median annual earnings by full-time, year-round workers fell in 2006, for the third year in a row, down about 1% for both men and women. Figure 1 shows annual earnings changes for these workers, who are, by definition, working year-round. Despite their efforts, men’s earnings have fallen 0.5% annually from 2000 to 2006, while those of women were rose only 0.2% annually (and, as noted, have fallen steadily since 2004).
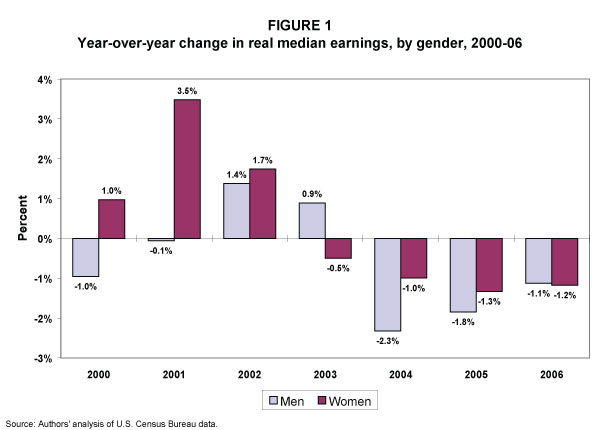
The decline in median earnings in tandem with higher household income at the median suggests that it was more hours worked and more people working, and not higher wages that generated the income growth for middle-class households last year.
The unequal distribution of growth between profits and compensation is playing a critical role in this result. Our research on corporate sector profits reveals that, had profits grown at the same rate as labor income between 2005 and 2006, then compensation would have been 1.1% higher for all workers: that is, the earnings declines among male and female full-year workers last year can be accounted for by a profit squeeze on wages.
Note also that this very weak wage performance has occurred while productivity growth increased 3% per year (2000-06). While economists and policy makers typically stress the positive performance of such indicators as productivity, GDP, or low unemployment, these earnings results clearly reveal that positive macro-conditions have not led to wage growth for typical full-year workers, as customarily had been the case.
Income inequality
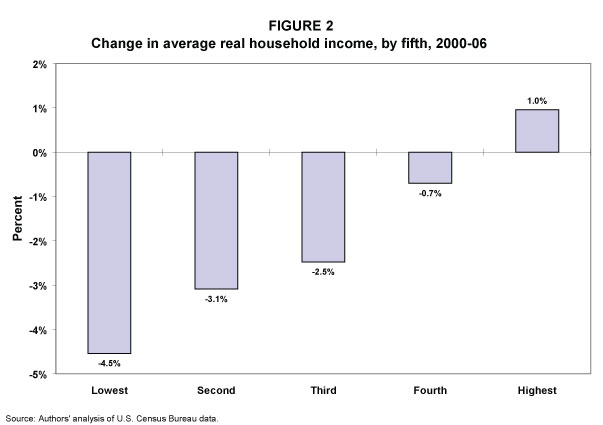
The main reason for this disjuncture between productivity and compensation is the increase in economic inequality. When growth is unequally distributed, positive indicators like faster GDP or productivity growth create only the potential for increased living standards. In a climate where too many workers lack the bargaining power they need to claim their fair share, we expect to see patterns like those in Figure 2, which clearly shows how income gains have been skewed toward those already at the top of the income scale.
Between 2000 and 2006, the average income of the lowest fifth is down 4.5%, the middle fifth is down 2.5%, and only the top fifth is up, by 1%. Similarly, today’s report revealed that the share of income going to the top fifth of households was 50.5%, the highest share on record going back to 1967. The middle-income share was 14.5%, the lowest on record. The bottom income share has been 3.4% since 2003, also an historic low.
Large losses for African American households
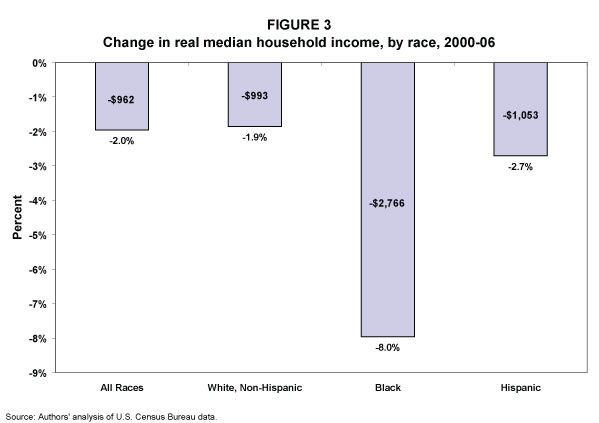
Examining income changes for different ethnicities reveals important disparities in economic outcomes. African Americans, whose median household income was unchanged last year (up a statistically insignificant 0.3%), have experienced particularly large losses since 2000 (see Figure 3), posting a loss of 8%, or about $2,800.
Working-age households
The median income of working-age households (those headed by someone less than 65) was up 1.3% last year, the first year of income growth since 2000. (This was driven exclusively by younger people, ages 15-24. Households headed by persons 25-64 saw only insignificant gains.1) Even so, the median income for these working-age households is down 4%, or about $2,400 lower than in 2000.
Historical landscape
How have poverty, income, and inequality developed over this business cycle compared to earlier ones? Since the 1970s, poverty rates have been largely insensitive to economic growth, due to factors ranging from slower and less equally distributed growth, higher average unemployment, diminished wage growth at the low end of the pay scale, and the greater share of one-parent families, who are more vulnerable to poverty.
These trends were reversed, however, for a period in the latter 1990s, as uniquely low unemployment, strong job creation, and faster productivity growth enabled more workers to claim a larger share of the growing economy.
Median household income, for example, rose less than 1% between 1967 (earliest available data) and 1995, before speeding up to an annual rate of 1.9% (1995-2000). For minority households, median income growth in the latter 1990s was especially strong, as was poverty reduction, with the median income up 3.4% for African Americans and 5.3% for Hispanics. Poverty for African American children fell an unprecedented 10.7 percentage points, compared to 2.1 points for white children.
The recession starting in 2001 halted these gains, and—as is virtually always the case in a widespread downturn—poverty began to rise and household incomes fell across the income scale, particularly for working-age households (though high-income households were hit hard by large capital losses in the early 2000s).
But when the recession ended in late 2001, poverty and median income did not improve. To the contrary, both have worsened since then, as the so-called jobless recovery made it too difficult for working families—those that depend on paychecks, not stock portfolios—t
o find enough employment in decent quality jobs.
Immigration’s impact on poverty
Some analysts have argued in the recent immigration debate that overall poverty trends are now largely driven by a larger immigrant population. The implication of this view is that poverty rates would improve and the economy grow if immigration were diminished or comprised of more highly skilled workers.
The data, however, do not bear out this view. While it is true that immigrants have higher poverty rates than natives (11.9% vs. 15.2% in 2006), immigrant poverty rates have fallen more quickly than that of non-immigrants in recent years. This positive development over time has to be balanced against the impact of a larger immigrant population.
Last year, for example, immigrant poverty fell 1.3 percentage points, compared to the statistically insignificant 0.2 percentage point decline for non-immigrants.
Another way to demonstrate this point is to ask what the overall poverty rate would have been in 2006 if the shares of immigrants and non-immigrants were frozen at the population shares of an earlier period. The difference between this simulated rate and the actual rate allows us to determine any pressure on poverty rates due to more immigrants. What we find is that if the immigrant share of the population was currently the same as it had been in 1993 (the first year Census poverty files include these data), the national poverty rate would be essentially unchanged (only one-tenth of a percent higher).
Health insurance
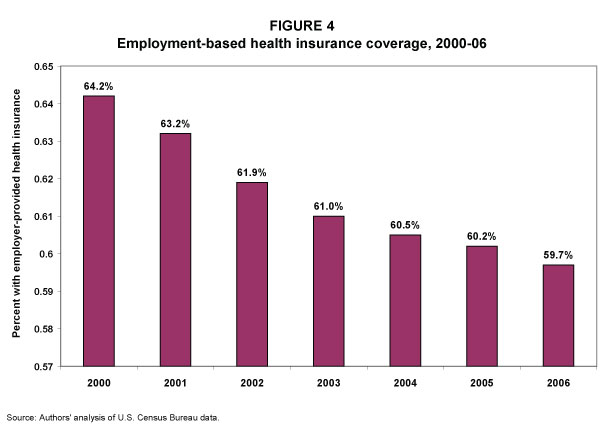
The decline in insurance coverage in this country can be attributed to declines in private coverage, particularly employment-based health insurance. There is evidence of further unraveling of the employer-based system:, the share of persons covered through work (either their own or a family member’s employer) declined for the sixth year in a row. As shown in Figure 4 below, employment based coverage was 59.7% in 2006, down from 60.2% in 2005 and a total of 4.5 percentage points since 2000.
The declines in employment-based coverage were particularly striking for dependents, as children under 18 without such coverage declined 1.2 percentage points over the year, continuing an annual decline since 2000 of 6.2 percentage points, from 65.9% to 59.7%. Public insurance has not been strong enough to offset these declines, and so the percent of uninsured children rose for the second year in a row. In the last two years, the number of uninsured children rose by 1 million, from 7.7 million in 2004 to 8.7 million in 2006.
—Research assistance by James Lin.
|
Trust the Trend But that by no means should lead analysts and policy makers to dismiss today’s findings. The most important information in this regard is not the poverty level, which is likely inaccurate, but the trend in poverty rates, which does provide an accurate depiction of the extent to which economic growth is reaching low-income families. The fact that poverty fell last year indicates that such families made some economic progress. The fact that the rate is still well above its 2000 level shows that little progress has been made. One reason to trust the trend is that much better measures of poverty, developed by the Census Bureau to update the official measure, closely track the trends in the official rate. Census publishes 12 such measures, all based on variations in recommendations made by the National Academy of Sciences. These measures have not yet been updated to 2006, but their average for 2005 was 13.4%, compared to the official rate, 12.6%. The average of the measures that most closely reflect the NAS recommendations was 13.9%. Most importantly, the trend in these more-accurate measures moves with the official rate. For example, the Census alternative measure that we judge to most-accurately reflect NAS recommendations rose 1.3 percentage points since 2000, the same growth rate of the official rate. In short, the fact that the official poverty measure is one percentage point above its 2000 level is stark evidence of the extent to which the benefits of growth since then have not been broadly shared. |
Endnote
1. This observation is based on data published today showing insignificant gains for each age category within the 25-64 group. We cannot determine whether the change for the group as a whole would be insignificant.
To view archived editions of INCOME PICTURE, click here.
The Economic Policy Institute INCOME PICTURE is published upon the annual release of family income data from the Census Bureau.
EPI offers same-day analysis of income, price, employment, and other economic data released by U.S. government agencies. For more information, contact EPI at 202-775-8810.
