July 22, 2009
Unequal unemplyment for African Americans and Hispanics
The national unemployment rate of 9.5% in June – the end of the second quarter – masks what continues to be a devastating recession for blacks and Hispanics. EPI has produced data that estimate unemployment rates in the 50 states and the District of Columbia by race, ethnicity and gender.
Due to sample size limitations, data are reliable for blacks in only 18 states and the District of Columbia, and for Hispanics in 12 states.
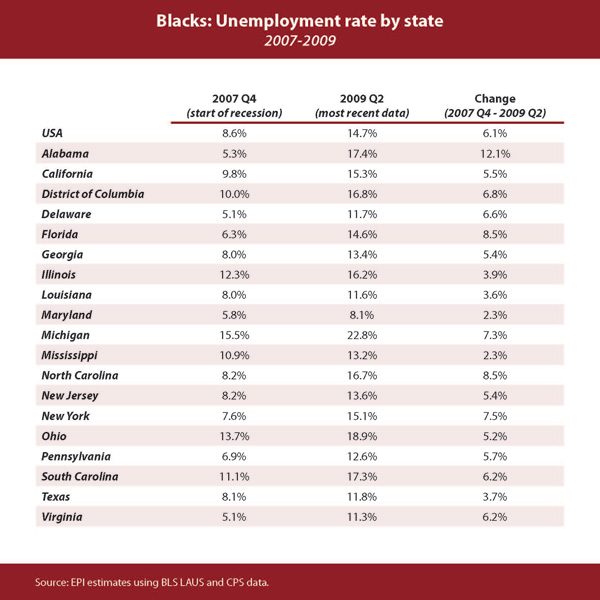
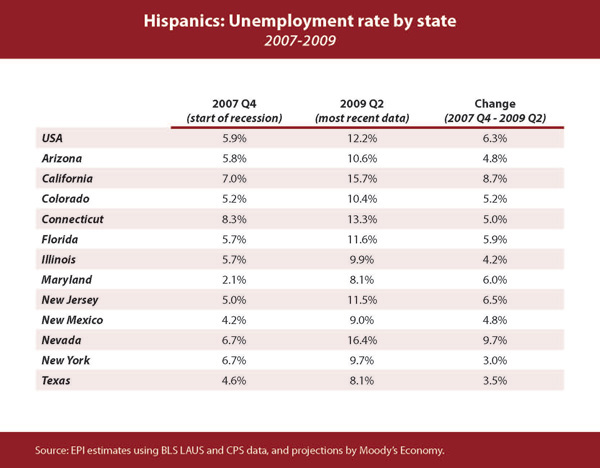
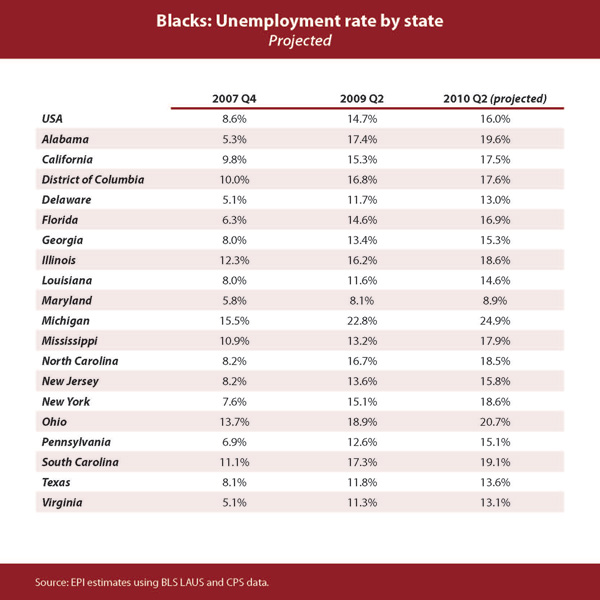
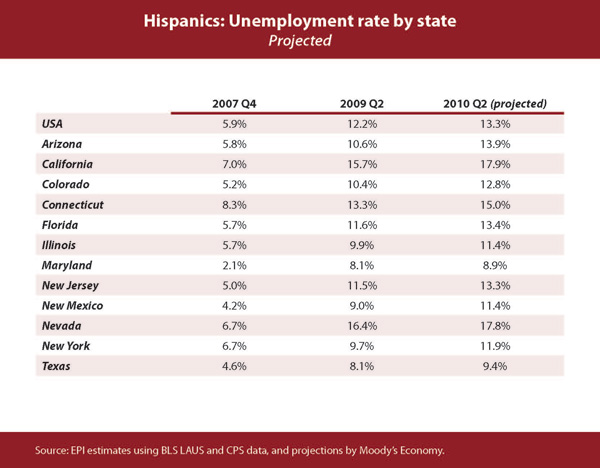
Projections for the second quarter (April, May and June) of 2010, when unemployment is expected to rise to 10.2% nationally, point to black unemployment reaching at least 13% for every state in our analysis except Maryland. For Hispanics, unemployment will reach double digits for all states in our analysis except Maryland and Texas.
Download a PDF of the full State Unemployment Rate by Race and Sex Table
Download an EPI Issue Brief taking a closer look at the state unemployment rate data
These data will be updated quarterly in late October, January, April and July.
Methodology
We use this unemployment rate from the LAUS as a benchmark to calculate rates for subgroups. These subgroups are generated either by race, gender, or both. For each state subgroup, we calculate the unemployment rate using the past six months of CPS data. We then find the ratio of this subgroup rate to the state unemployment rate using the same period of CPS data. This gives us an estimate of how the subgroup compares to the state overall. For example, African Americans in California in 2009Q1 had an unemployment rate that was about 1.6 times as high as the overall rate. We then take this ratio (of 6 month CPS data) and multiply it by the LAUS unemployment rate for that state and quarter. Given the LAUS rate of 10.6% in California, and the 1.6 ratio found earlier, we estimate that African-Americans had an unemployment rate of 16.5%.
For our projections, we use the same method but modify it slightly. We find the subgroup/state ratios from the most recent 6 months of data, then multiply this ratio by the projected state unemployment rate for a given quarter.
In many states, the sample size of these subgroups is not large enough to create an accurate estimate of their unemployment rate. We only report data for groups which had, on average, a sample size of at least 700 in the labor force for each 6-month period. Assuming an unemployment rate of 8%, this results in a margin of error of ±2 percentage points. With an unemployment rate of 20%, the margin of error is ±3 percentage points.