The November employment report released this morning by the Bureau of Labor Statistics contained some relatively positive news, with the establishment survey showing an increase of 203,000 jobs. Jobs growth occurred across most industries, including gains in manufacturing, retail trade, transportation, professional services, and health care. While this is promising, especially because it comes on the heels of 200,000 jobs added in October, we still need 7.9 million jobs to get back to the prerecession unemployment rate.
Additionally, millions of potential workers remain sidelined. There are nearly 5.7 million workers who are neither employed nor actively seeking a job. These are people who would be working or looking for work if job opportunities were significantly stronger. If they were counted among the unemployed, the unemployment rate would have been 10.3 percent in November.
As expected, the November employment report showed some reversal of October’s trends in the household survey data. Because of the distortions in the October household survey from the government shutdown, the change from October to November provides little information about the underlying labor market trend. Instead, it’s important to focus on shifts over longer time periods.
For instance, while the data show an increase in labor force participation between October and November, this is due in part to misclassification of furloughed workers in October. The labor force participation rate in November is still lower than it was in September. It is clear that the drop in the unemployment rate to 7.0 percent (since September’s rate of 7.2 percent) is due to a drop in labor force participation and not to a large increase in the number employed. The working age (25–54 years old) employment-to-population ratio in November is 75.9 percent, exactly what it was in September.
Other trends include:
1. The government shutdown is behind us, but the public sector is still down 1.47 million jobs.
2. Long-term unemployment rose, making it all the more important to extend unemployment insurance benefits.
3. High unemployment continues to plague all demographic and occupational groups.
We now examine each of these in turn.
1. The government shutdown is behind us, but the public sector is still down 1.47 million jobs
The talk about the effects of the October government shutdown on public-sector employment is largely a distraction from the larger issue, namely just how many jobs the economy needs to create to return to prerecession levels of public-sector employment. In addition to the economic ramifications of the 800,000 furloughed government employees in October, we still face a sizable jobs shortfall in public-sector employment, as shown in the figure below.
While there have been 728,000 public-sector jobs lost, we need another 744,000 on top of that to keep up with population growth. In total, the public-sector employment deficit since 2009 sits at 1.47 million.
The public-sector jobs gap

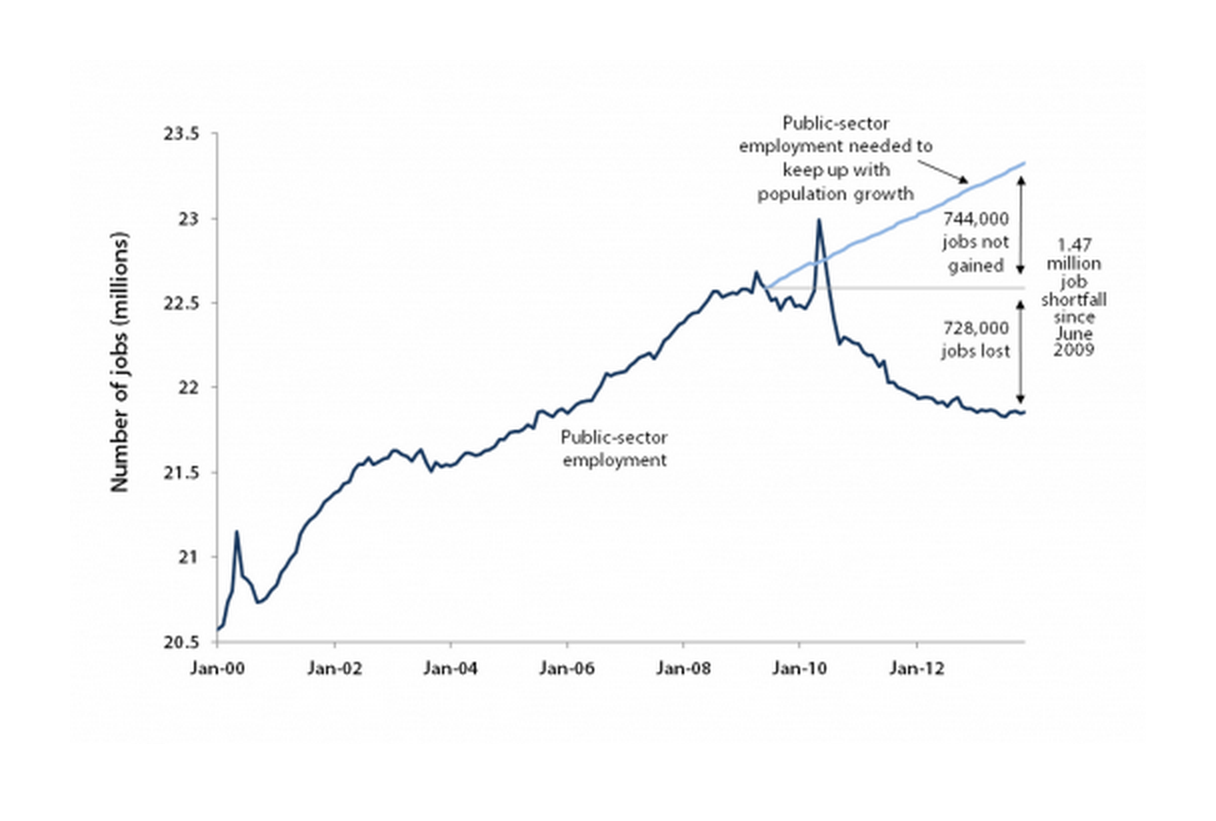

Note: The spikes in public-sector employment in 2000 and 2010 are temporary workers hired to conduct the decennial Census.
Source: Public-sector employment is from the Bureau of Labor Statistics Current Employment Statistics public data series. Population data are from FRED (Federal Reserve Economic Data), "Total Population: All Ages including Armed Forces Overseas."
2. Long-term unemployment rose, making it all the more important to extend unemployment insurance benefits
While the overall unemployment rate declined, long-term unemployment rose. While the share of unemployed workers who have been out of work for more than six months has generally been coming down since its peak of 45.3 percent in March 2011, it increased in November from 36.1 percent to 37.3 percent (increasing as well from the September rate of 36.9 percent, arguably a better benchmark), as shown in the figure below. Today, the long-term unemployment rate is more than double the average rate in 2007.
The share of the unemployed who have been jobless for six months or more, 1948–2013
| Date | Share of the unemployed |
|---|---|
| Jan-1948 | 6.4% |
| Feb-1948 | 5.2% |
| Mar-1948 | 4.6% |
| Apr-1948 | 4.4% |
| May-1948 | 5.1% |
| Jun-1948 | 5.3% |
| Jul-1948 | 4.9% |
| Aug-1948 | 5.3% |
| Sep-1948 | 5.5% |
| Oct-1948 | 6.2% |
| Nov-1948 | 4.3% |
| Dec-1948 | 4.1% |
| Jan-1949 | 4.1% |
| Feb-1949 | 4.5% |
| Mar-1949 | 3.8% |
| Apr-1949 | 4.8% |
| May-1949 | 5.1% |
| Jun-1949 | 6.5% |
| Jul-1949 | 7.5% |
| Aug-1949 | 8.0% |
| Sep-1949 | 8.6% |
| Oct-1949 | 7.8% |
| Nov-1949 | 10.6% |
| Dec-1949 | 10.0% |
| Jan-1950 | 10.0% |
| Feb-1950 | 10.5% |
| Mar-1950 | 11.3% |
| Apr-1950 | 13.4% |
| May-1950 | 12.3% |
| Jun-1950 | 12.3% |
| Jul-1950 | 10.8% |
| Aug-1950 | 10.5% |
| Sep-1950 | 10.6% |
| Oct-1950 | 10.9% |
| Nov-1950 | 9.9% |
| Dec-1950 | 8.1% |
| Jan-1951 | 8.0% |
| Feb-1951 | 9.4% |
| Mar-1951 | 7.2% |
| Apr-1951 | 7.2% |
| May-1951 | 6.9% |
| Jun-1951 | 5.6% |
| Jul-1951 | 6.6% |
| Aug-1951 | 6.0% |
| Sep-1951 | 5.7% |
| Oct-1951 | 4.6% |
| Nov-1951 | 7.1% |
| Dec-1951 | 5.2% |
| Jan-1952 | 5.5% |
| Feb-1952 | 4.5% |
| Mar-1952 | 4.7% |
| Apr-1952 | 6.3% |
| May-1952 | 4.3% |
| Jun-1952 | 3.6% |
| Jul-1952 | 3.4% |
| Aug-1952 | 3.0% |
| Sep-1952 | 3.3% |
| Oct-1952 | 4.8% |
| Nov-1952 | 3.9% |
| Dec-1952 | 6.2% |
| Jan-1953 | 4.8% |
| Feb-1953 | 4.8% |
| Mar-1953 | 5.0% |
| Apr-1953 | 3.9% |
| May-1953 | 2.9% |
| Jun-1953 | 5.8% |
| Jul-1953 | 4.4% |
| Aug-1953 | 4.0% |
| Sep-1953 | 3.8% |
| Oct-1953 | 3.4% |
| Nov-1953 | 4.5% |
| Dec-1953 | 4.0% |
| Jan-1954 | 4.9% |
| Feb-1954 | 4.6% |
| Mar-1954 | 6.5% |
| Apr-1954 | 7.6% |
| May-1954 | 8.5% |
| Jun-1954 | 8.8% |
| Jul-1954 | 9.1% |
| Aug-1954 | 11.0% |
| Sep-1954 | 10.6% |
| Oct-1954 | 12.3% |
| Nov-1954 | 12.3% |
| Dec-1954 | 12.1% |
| Jan-1955 | 13.3% |
| Feb-1955 | 14.7% |
| Mar-1955 | 13.4% |
| Apr-1955 | 13.5% |
| May-1955 | 13.1% |
| Jun-1955 | 12.2% |
| Jul-1955 | 11.4% |
| Aug-1955 | 9.9% |
| Sep-1955 | 9.2% |
| Oct-1955 | 8.6% |
| Nov-1955 | 9.9% |
| Dec-1955 | 10.4% |
| Jan-1956 | 9.6% |
| Feb-1956 | 10.6% |
| Mar-1956 | 8.6% |
| Apr-1956 | 7.7% |
| May-1956 | 6.9% |
| Jun-1956 | 6.2% |
| Jul-1956 | 7.1% |
| Aug-1956 | 8.7% |
| Sep-1956 | 9.1% |
| Oct-1956 | 9.5% |
| Nov-1956 | 8.4% |
| Dec-1956 | 9.2% |
| Jan-1957 | 6.5% |
| Feb-1957 | 8.6% |
| Mar-1957 | 8.6% |
| Apr-1957 | 9.0% |
| May-1957 | 8.7% |
| Jun-1957 | 8.9% |
| Jul-1957 | 9.2% |
| Aug-1957 | 8.4% |
| Sep-1957 | 7.4% |
| Oct-1957 | 9.6% |
| Nov-1957 | 8.2% |
| Dec-1957 | 7.4% |
| Jan-1958 | 7.7% |
| Feb-1958 | 8.1% |
| Mar-1958 | 7.7% |
| Apr-1958 | 10.5% |
| May-1958 | 11.6% |
| Jun-1958 | 14.2% |
| Jul-1958 | 16.6% |
| Aug-1958 | 19.0% |
| Sep-1958 | 20.7% |
| Oct-1958 | 20.3% |
| Nov-1958 | 19.5% |
| Dec-1958 | 19.2% |
| Jan-1959 | 19.4% |
| Feb-1959 | 18.3% |
| Mar-1959 | 18.1% |
| Apr-1959 | 18.2% |
| May-1959 | 16.7% |
| Jun-1959 | 15.9% |
| Jul-1959 | 14.0% |
| Aug-1959 | 13.4% |
| Sep-1959 | 11.8% |
| Oct-1959 | 11.4% |
| Nov-1959 | 12.1% |
| Dec-1959 | 12.6% |
| Jan-1960 | 12.9% |
| Feb-1960 | 13.0% |
| Mar-1960 | 11.7% |
| Apr-1960 | 11.9% |
| May-1960 | 10.8% |
| Jun-1960 | 10.5% |
| Jul-1960 | 10.5% |
| Aug-1960 | 10.4% |
| Sep-1960 | 12.0% |
| Oct-1960 | 13.4% |
| Nov-1960 | 12.8% |
| Dec-1960 | 11.8% |
| Jan-1961 | 13.6% |
| Feb-1961 | 13.7% |
| Mar-1961 | 14.5% |
| Apr-1961 | 16.9% |
| May-1961 | 17.7% |
| Jun-1961 | 18.9% |
| Jul-1961 | 19.9% |
| Aug-1961 | 19.0% |
| Sep-1961 | 18.0% |
| Oct-1961 | 17.9% |
| Nov-1961 | 17.8% |
| Dec-1961 | 17.3% |
| Jan-1962 | 16.5% |
| Feb-1962 | 17.7% |
| Mar-1962 | 16.3% |
| Apr-1962 | 16.2% |
| May-1962 | 16.5% |
| Jun-1962 | 15.2% |
| Jul-1962 | 14.9% |
| Aug-1962 | 14.7% |
| Sep-1962 | 13.1% |
| Oct-1962 | 13.3% |
| Nov-1962 | 11.1% |
| Dec-1962 | 12.8% |
| Jan-1963 | 13.3% |
| Feb-1963 | 14.0% |
| Mar-1963 | 14.8% |
| Apr-1963 | 14.7% |
| May-1963 | 14.4% |
| Jun-1963 | 12.4% |
| Jul-1963 | 13.5% |
| Aug-1963 | 13.2% |
| Sep-1963 | 14.0% |
| Oct-1963 | 13.3% |
| Nov-1963 | 12.6% |
| Dec-1963 | 12.3% |
| Jan-1964 | 12.5% |
| Feb-1964 | 12.4% |
| Mar-1964 | 12.8% |
| Apr-1964 | 12.1% |
| May-1964 | 13.4% |
| Jun-1964 | 13.1% |
| Jul-1964 | 14.5% |
| Aug-1964 | 13.7% |
| Sep-1964 | 12.4% |
| Oct-1964 | 11.7% |
| Nov-1964 | 12.3% |
| Dec-1964 | 11.9% |
| Jan-1965 | 11.1% |
| Feb-1965 | 11.0% |
| Mar-1965 | 10.2% |
| Apr-1965 | 10.3% |
| May-1965 | 10.2% |
| Jun-1965 | 10.7% |
| Jul-1965 | 9.8% |
| Aug-1965 | 10.0% |
| Sep-1965 | 11.1% |
| Oct-1965 | 10.8% |
| Nov-1965 | 10.1% |
| Dec-1965 | 9.9% |
| Jan-1966 | 9.9% |
| Feb-1966 | 9.5% |
| Mar-1966 | 9.2% |
| Apr-1966 | 9.0% |
| May-1966 | 9.5% |
| Jun-1966 | 7.9% |
| Jul-1966 | 7.3% |
| Aug-1966 | 7.0% |
| Sep-1966 | 7.1% |
| Oct-1966 | 7.9% |
| Nov-1966 | 7.3% |
| Dec-1966 | 7.5% |
| Jan-1967 | 6.9% |
| Feb-1967 | 6.9% |
| Mar-1967 | 6.2% |
| Apr-1967 | 6.1% |
| May-1967 | 5.3% |
| Jun-1967 | 5.0% |
| Jul-1967 | 5.2% |
| Aug-1967 | 6.7% |
| Sep-1967 | 5.4% |
| Oct-1967 | 5.6% |
| Nov-1967 | 5.9% |
| Dec-1967 | 6.5% |
| Jan-1968 | 6.6% |
| Feb-1968 | 5.9% |
| Mar-1968 | 6.2% |
| Apr-1968 | 5.5% |
| May-1968 | 5.0% |
| Jun-1968 | 5.4% |
| Jul-1968 | 5.5% |
| Aug-1968 | 5.5% |
| Sep-1968 | 4.9% |
| Oct-1968 | 5.0% |
| Nov-1968 | 4.8% |
| Dec-1968 | 6.0% |
| Jan-1969 | 4.9% |
| Feb-1969 | 4.3% |
| Mar-1969 | 4.4% |
| Apr-1969 | 4.8% |
| May-1969 | 4.7% |
| Jun-1969 | 4.4% |
| Jul-1969 | 5.6% |
| Aug-1969 | 4.6% |
| Sep-1969 | 4.9% |
| Oct-1969 | 4.5% |
| Nov-1969 | 5.1% |
| Dec-1969 | 4.6% |
| Jan-1970 | 4.5% |
| Feb-1970 | 4.6% |
| Mar-1970 | 5.0% |
| Apr-1970 | 5.3% |
| May-1970 | 5.9% |
| Jun-1970 | 5.5% |
| Jul-1970 | 5.7% |
| Aug-1970 | 5.9% |
| Sep-1970 | 6.3% |
| Oct-1970 | 5.6% |
| Nov-1970 | 6.7% |
| Dec-1970 | 7.6% |
| Jan-1971 | 8.5% |
| Feb-1971 | 9.2% |
| Mar-1971 | 9.3% |
| Apr-1971 | 9.2% |
| May-1971 | 10.2% |
| Jun-1971 | 10.9% |
| Jul-1971 | 11.3% |
| Aug-1971 | 10.6% |
| Sep-1971 | 11.0% |
| Oct-1971 | 11.7% |
| Nov-1971 | 11.2% |
| Dec-1971 | 11.4% |
| Jan-1972 | 11.7% |
| Feb-1972 | 13.4% |
| Mar-1972 | 12.8% |
| Apr-1972 | 13.6% |
| May-1972 | 11.9% |
| Jun-1972 | 11.2% |
| Jul-1972 | 10.6% |
| Aug-1972 | 10.8% |
| Sep-1972 | 11.2% |
| Oct-1972 | 10.6% |
| Nov-1972 | 10.2% |
| Dec-1972 | 10.2% |
| Jan-1973 | 9.5% |
| Feb-1973 | 8.4% |
| Mar-1973 | 8.9% |
| Apr-1973 | 7.5% |
| May-1973 | 8.0% |
| Jun-1973 | 7.5% |
| Jul-1973 | 6.5% |
| Aug-1973 | 7.7% |
| Sep-1973 | 6.8% |
| Oct-1973 | 8.0% |
| Nov-1973 | 8.0% |
| Dec-1973 | 7.4% |
| Jan-1974 | 7.2% |
| Feb-1974 | 7.1% |
| Mar-1974 | 7.1% |
| Apr-1974 | 7.6% |
| May-1974 | 7.5% |
| Jun-1974 | 7.4% |
| Jul-1974 | 7.7% |
| Aug-1974 | 7.7% |
| Sep-1974 | 7.2% |
| Oct-1974 | 7.2% |
| Nov-1974 | 7.1% |
| Dec-1974 | 8.1% |
| Jan-1975 | 8.3% |
| Feb-1975 | 9.7% |
| Mar-1975 | 9.7% |
| Apr-1975 | 11.9% |
| May-1975 | 13.0% |
| Jun-1975 | 15.8% |
| Jul-1975 | 17.3% |
| Aug-1975 | 18.3% |
| Sep-1975 | 19.6% |
| Oct-1975 | 18.0% |
| Nov-1975 | 21.0% |
| Dec-1975 | 20.3% |
| Jan-1976 | 20.8% |
| Feb-1976 | 21.0% |
| Mar-1976 | 20.7% |
| Apr-1976 | 19.7% |
| May-1976 | 17.5% |
| Jun-1976 | 18.3% |
| Jul-1976 | 16.8% |
| Aug-1976 | 16.9% |
| Sep-1976 | 16.0% |
| Oct-1976 | 16.4% |
| Nov-1976 | 16.8% |
| Dec-1976 | 17.6% |
| Jan-1977 | 16.6% |
| Feb-1977 | 16.2% |
| Mar-1977 | 16.0% |
| Apr-1977 | 16.1% |
| May-1977 | 15.6% |
| Jun-1977 | 14.4% |
| Jul-1977 | 14.3% |
| Aug-1977 | 12.9% |
| Sep-1977 | 13.7% |
| Oct-1977 | 13.4% |
| Nov-1977 | 13.2% |
| Dec-1977 | 13.4% |
| Jan-1978 | 12.6% |
| Feb-1978 | 10.6% |
| Mar-1978 | 11.2% |
| Apr-1978 | 11.1% |
| May-1978 | 11.3% |
| Jun-1978 | 10.5% |
| Jul-1978 | 10.4% |
| Aug-1978 | 10.1% |
| Sep-1978 | 10.2% |
| Oct-1978 | 10.0% |
| Nov-1978 | 8.8% |
| Dec-1978 | 8.2% |
| Jan-1979 | 8.8% |
| Feb-1979 | 9.0% |
| Mar-1979 | 9.6% |
| Apr-1979 | 9.0% |
| May-1979 | 8.8% |
| Jun-1979 | 8.8% |
| Jul-1979 | 7.8% |
| Aug-1979 | 8.5% |
| Sep-1979 | 8.6% |
| Oct-1979 | 8.5% |
| Nov-1979 | 9.0% |
| Dec-1979 | 8.6% |
| Jan-1980 | 8.3% |
| Feb-1980 | 7.6% |
| Mar-1980 | 9.1% |
| Apr-1980 | 9.3% |
| May-1980 | 8.9% |
| Jun-1980 | 9.6% |
| Jul-1980 | 10.7% |
| Aug-1980 | 11.3% |
| Sep-1980 | 12.0% |
| Oct-1980 | 13.1% |
| Nov-1980 | 14.2% |
| Dec-1980 | 14.8% |
| Jan-1981 | 15.7% |
| Feb-1981 | 15.5% |
| Mar-1981 | 15.2% |
| Apr-1981 | 14.4% |
| May-1981 | 14.0% |
| Jun-1981 | 14.0% |
| Jul-1981 | 13.8% |
| Aug-1981 | 14.5% |
| Sep-1981 | 13.5% |
| Oct-1981 | 13.2% |
| Nov-1981 | 12.7% |
| Dec-1981 | 12.6% |
| Jan-1982 | 12.6% |
| Feb-1982 | 13.2% |
| Mar-1982 | 13.6% |
| Apr-1982 | 14.6% |
| May-1982 | 15.5% |
| Jun-1982 | 17.0% |
| Jul-1982 | 16.8% |
| Aug-1982 | 17.0% |
| Sep-1982 | 17.8% |
| Oct-1982 | 19.5% |
| Nov-1982 | 19.5% |
| Dec-1982 | 21.3% |
| Jan-1983 | 22.9% |
| Feb-1983 | 23.5% |
| Mar-1983 | 24.4% |
| Apr-1983 | 24.6% |
| May-1983 | 24.9% |
| Jun-1983 | 26.0% |
| Jul-1983 | 24.5% |
| Aug-1983 | 23.6% |
| Sep-1983 | 23.5% |
| Oct-1983 | 23.1% |
| Nov-1983 | 22.7% |
| Dec-1983 | 22.0% |
| Jan-1984 | 22.4% |
| Feb-1984 | 20.8% |
| Mar-1984 | 20.4% |
| Apr-1984 | 20.3% |
| May-1984 | 20.0% |
| Jun-1984 | 19.3% |
| Jul-1984 | 18.7% |
| Aug-1984 | 17.6% |
| Sep-1984 | 17.2% |
| Oct-1984 | 17.1% |
| Nov-1984 | 17.4% |
| Dec-1984 | 16.7% |
| Jan-1985 | 15.5% |
| Feb-1985 | 16.2% |
| Mar-1985 | 16.1% |
| Apr-1985 | 16.4% |
| May-1985 | 14.8% |
| Jun-1985 | 15.3% |
| Jul-1985 | 15.0% |
| Aug-1985 | 14.9% |
| Sep-1985 | 14.8% |
| Oct-1985 | 14.5% |
| Nov-1985 | 16.0% |
| Dec-1985 | 14.8% |
| Jan-1986 | 13.9% |
| Feb-1986 | 14.1% |
| Mar-1986 | 14.0% |
| Apr-1986 | 13.9% |
| May-1986 | 13.8% |
| Jun-1986 | 15.0% |
| Jul-1986 | 14.7% |
| Aug-1986 | 14.7% |
| Sep-1986 | 14.8% |
| Oct-1986 | 14.8% |
| Nov-1986 | 14.3% |
| Dec-1986 | 14.6% |
| Jan-1987 | 14.3% |
| Feb-1987 | 14.2% |
| Mar-1987 | 14.3% |
| Apr-1987 | 14.4% |
| May-1987 | 14.8% |
| Jun-1987 | 14.5% |
| Jul-1987 | 13.5% |
| Aug-1987 | 14.5% |
| Sep-1987 | 13.9% |
| Oct-1987 | 13.3% |
| Nov-1987 | 13.1% |
| Dec-1987 | 13.0% |
| Jan-1988 | 12.5% |
| Feb-1988 | 12.9% |
| Mar-1988 | 12.3% |
| Apr-1988 | 12.3% |
| May-1988 | 12.5% |
| Jun-1988 | 12.3% |
| Jul-1988 | 11.9% |
| Aug-1988 | 11.7% |
| Sep-1988 | 12.3% |
| Oct-1988 | 11.8% |
| Nov-1988 | 10.8% |
| Dec-1988 | 11.4% |
| Jan-1989 | 11.0% |
| Feb-1989 | 10.0% |
| Mar-1989 | 10.7% |
| Apr-1989 | 11.0% |
| May-1989 | 9.9% |
| Jun-1989 | 9.3% |
| Jul-1989 | 9.5% |
| Aug-1989 | 8.7% |
| Sep-1989 | 9.1% |
| Oct-1989 | 9.8% |
| Nov-1989 | 9.8% |
| Dec-1989 | 9.6% |
| Jan-1990 | 9.7% |
| Feb-1990 | 9.4% |
| Mar-1990 | 9.6% |
| Apr-1990 | 9.5% |
| May-1990 | 9.5% |
| Jun-1990 | 9.5% |
| Jul-1990 | 9.8% |
| Aug-1990 | 10.2% |
| Sep-1990 | 10.6% |
| Oct-1990 | 10.4% |
| Nov-1990 | 10.8% |
| Dec-1990 | 10.6% |
| Jan-1991 | 10.9% |
| Feb-1991 | 10.9% |
| Mar-1991 | 11.1% |
| Apr-1991 | 11.6% |
| May-1991 | 11.9% |
| Jun-1991 | 12.6% |
| Jul-1991 | 12.9% |
| Aug-1991 | 13.5% |
| Sep-1991 | 13.7% |
| Oct-1991 | 13.9% |
| Nov-1991 | 15.4% |
| Dec-1991 | 16.4% |
| Jan-1992 | 17.5% |
| Feb-1992 | 18.1% |
| Mar-1992 | 18.8% |
| Apr-1992 | 18.9% |
| May-1992 | 20.6% |
| Jun-1992 | 21.3% |
| Jul-1992 | 21.5% |
| Aug-1992 | 21.0% |
| Sep-1992 | 21.5% |
| Oct-1992 | 23.1% |
| Nov-1992 | 20.7% |
| Dec-1992 | 21.4% |
| Jan-1993 | 21.2% |
| Feb-1993 | 20.7% |
| Mar-1993 | 20.0% |
| Apr-1993 | 18.2% |
| May-1993 | 19.6% |
| Jun-1993 | 19.5% |
| Jul-1993 | 19.8% |
| Aug-1993 | 20.1% |
| Sep-1993 | 20.2% |
| Oct-1993 | 20.4% |
| Nov-1993 | 21.0% |
| Dec-1993 | 20.8% |
| Jan-1994 | 20.1% |
| Feb-1994 | 20.7% |
| Mar-1994 | 21.2% |
| Apr-1994 | 21.3% |
| May-1994 | 21.3% |
| Jun-1994 | 19.9% |
| Jul-1994 | 19.6% |
| Aug-1994 | 19.6% |
| Sep-1994 | 20.0% |
| Oct-1994 | 20.8% |
| Nov-1994 | 19.7% |
| Dec-1994 | 18.9% |
| Jan-1995 | 18.3% |
| Feb-1995 | 17.2% |
| Mar-1995 | 18.8% |
| Apr-1995 | 18.7% |
| May-1995 | 17.5% |
| Jun-1995 | 16.8% |
| Jul-1995 | 16.7% |
| Aug-1995 | 16.3% |
| Sep-1995 | 16.9% |
| Oct-1995 | 16.5% |
| Nov-1995 | 16.7% |
| Dec-1995 | 16.4% |
| Jan-1996 | 16.2% |
| Feb-1996 | 16.5% |
| Mar-1996 | 18.2% |
| Apr-1996 | 18.3% |
| May-1996 | 18.1% |
| Jun-1996 | 19.4% |
| Jul-1996 | 18.3% |
| Aug-1996 | 18.2% |
| Sep-1996 | 17.4% |
| Oct-1996 | 16.7% |
| Nov-1996 | 15.7% |
| Dec-1996 | 16.1% |
| Jan-1997 | 16.1% |
| Feb-1997 | 15.7% |
| Mar-1997 | 15.6% |
| Apr-1997 | 16.2% |
| May-1997 | 15.7% |
| Jun-1997 | 15.8% |
| Jul-1997 | 16.3% |
| Aug-1997 | 16.2% |
| Sep-1997 | 16.2% |
| Oct-1997 | 16.0% |
| Nov-1997 | 14.8% |
| Dec-1997 | 15.4% |
| Jan-1998 | 15.7% |
| Feb-1998 | 15.2% |
| Mar-1998 | 14.1% |
| Apr-1998 | 14.7% |
| May-1998 | 13.8% |
| Jun-1998 | 12.6% |
| Jul-1998 | 13.3% |
| Aug-1998 | 13.2% |
| Sep-1998 | 14.5% |
| Oct-1998 | 13.6% |
| Nov-1998 | 14.4% |
| Dec-1998 | 13.5% |
| Jan-1999 | 12.0% |
| Feb-1999 | 13.2% |
| Mar-1999 | 12.2% |
| Apr-1999 | 11.4% |
| May-1999 | 12.4% |
| Jun-1999 | 13.7% |
| Jul-1999 | 12.3% |
| Aug-1999 | 12.1% |
| Sep-1999 | 12.0% |
| Oct-1999 | 12.4% |
| Nov-1999 | 11.9% |
| Dec-1999 | 12.1% |
| Jan-2000 | 12.7% |
| Feb-2000 | 10.8% |
| Mar-2000 | 11.0% |
| Apr-2000 | 10.7% |
| May-2000 | 11.1% |
| Jun-2000 | 11.2% |
| Jul-2000 | 12.3% |
| Aug-2000 | 12.2% |
| Sep-2000 | 11.5% |
| Oct-2000 | 11.3% |
| Nov-2000 | 10.6% |
| Dec-2000 | 11.4% |
| Jan-2001 | 11.3% |
| Feb-2001 | 11.7% |
| Mar-2001 | 11.1% |
| Apr-2001 | 11.0% |
| May-2001 | 10.0% |
| Jun-2001 | 11.2% |
| Jul-2001 | 10.8% |
| Aug-2001 | 12.2% |
| Sep-2001 | 11.5% |
| Oct-2001 | 11.8% |
| Nov-2001 | 13.9% |
| Dec-2001 | 13.6% |
| Jan-2002 | 14.6% |
| Feb-2002 | 14.9% |
| Mar-2002 | 15.9% |
| Apr-2002 | 16.8% |
| May-2002 | 18.8% |
| Jun-2002 | 19.6% |
| Jul-2002 | 19.0% |
| Aug-2002 | 18.9% |
| Sep-2002 | 19.1% |
| Oct-2002 | 19.9% |
| Nov-2002 | 20.5% |
| Dec-2002 | 22.1% |
| Jan-2003 | 20.5% |
| Feb-2003 | 21.8% |
| Mar-2003 | 21.0% |
| Apr-2003 | 21.9% |
| May-2003 | 21.6% |
| Jun-2003 | 22.8% |
| Jul-2003 | 22.0% |
| Aug-2003 | 22.2% |
| Sep-2003 | 22.5% |
| Oct-2003 | 22.4% |
| Nov-2003 | 23.4% |
| Dec-2003 | 23.1% |
| Jan-2004 | 22.7% |
| Feb-2004 | 22.9% |
| Mar-2004 | 23.6% |
| Apr-2004 | 22.1% |
| May-2004 | 21.9% |
| Jun-2004 | 22.5% |
| Jul-2004 | 20.7% |
| Aug-2004 | 20.3% |
| Sep-2004 | 21.4% |
| Oct-2004 | 21.5% |
| Nov-2004 | 21.4% |
| Dec-2004 | 20.8% |
| Jan-2005 | 21.2% |
| Feb-2005 | 20.4% |
| Mar-2005 | 21.8% |
| Apr-2005 | 21.0% |
| May-2005 | 20.1% |
| Jun-2005 | 18.5% |
| Jul-2005 | 18.7% |
| Aug-2005 | 18.9% |
| Sep-2005 | 18.9% |
| Oct-2005 | 18.9% |
| Nov-2005 | 18.0% |
| Dec-2005 | 18.7% |
| Jan-2006 | 16.7% |
| Feb-2006 | 18.7% |
| Mar-2006 | 18.6% |
| Apr-2006 | 18.6% |
| May-2006 | 18.9% |
| Jun-2006 | 16.6% |
| Jul-2006 | 18.3% |
| Aug-2006 | 18.3% |
| Sep-2006 | 18.1% |
| Oct-2006 | 15.9% |
| Nov-2006 | 16.4% |
| Dec-2006 | 16.2% |
| Jan-2007 | 16.3% |
| Feb-2007 | 18.0% |
| Mar-2007 | 18.6% |
| Apr-2007 | 17.4% |
| May-2007 | 16.5% |
| Jun-2007 | 16.4% |
| Jul-2007 | 18.3% |
| Aug-2007 | 17.5% |
| Sep-2007 | 17.5% |
| Oct-2007 | 17.7% |
| Nov-2007 | 18.9% |
| Dec-2007 | 17.4% |
| Jan-2008 | 18.5% |
| Feb-2008 | 17.8% |
| Mar-2008 | 16.9% |
| Apr-2008 | 17.7% |
| May-2008 | 18.3% |
| Jun-2008 | 18.2% |
| Jul-2008 | 18.9% |
| Aug-2008 | 19.8% |
| Sep-2008 | 21.3% |
| Oct-2008 | 22.3% |
| Nov-2008 | 21.1% |
| Dec-2008 | 23.1% |
| Jan-2009 | 22.6% |
| Feb-2009 | 23.5% |
| Mar-2009 | 24.3% |
| Apr-2009 | 26.9% |
| May-2009 | 27.0% |
| Jun-2009 | 29.0% |
| Jul-2009 | 33.9% |
| Aug-2009 | 34.3% |
| Sep-2009 | 36.6% |
| Oct-2009 | 36.6% |
| Nov-2009 | 39.4% |
| Dec-2009 | 40.3% |
| Jan-2010 | 41.6% |
| Feb-2010 | 41.1% |
| Mar-2010 | 43.7% |
| Apr-2010 | 45.0% |
| May-2010 | 44.9% |
| Jun-2010 | 44.8% |
| Jul-2010 | 44.6% |
| Aug-2010 | 42.7% |
| Sep-2010 | 42.2% |
| Oct-2010 | 42.6% |
| Nov-2010 | 42.4% |
| Dec-2010 | 44.6% |
| Jan-2011 | 44.0% |
| Feb-2011 | 43.7% |
| Mar-2011 | 45.3% |
| Apr-2011 | 42.6% |
| May-2011 | 44.6% |
| Jun-2011 | 44.1% |
| Jul-2011 | 44.5% |
| Aug-2011 | 43.3% |
| Sep-2011 | 44.9% |
| Oct-2011 | 42.6% |
| Nov-2011 | 43.2% |
| Dec-2011 | 42.8% |
| Jan-2012 | 43.0% |
| Feb-2012 | 42.3% |
| Mar-2012 | 42.2% |
| Apr-2012 | 40.5% |
| May-2012 | 42.4% |
| Jun-2012 | 41.7% |
| Jul-2012 | 40.6% |
| Aug-2012 | 40.0% |
| Sep-2012 | 40.3% |
| Oct-2012 | 40.8% |
| Nov-2012 | 40.0% |
| Dec-2012 | 39.1% |
| Jan-2013 | 38.1% |
| Feb-2013 | 40.2% |
| Mar-2013 | 39.6% |
| Apr-2013 | 37.4% |
| May-2013 | 37.3% |
| Jun-2013 | 36.7% |
| Jul-2013 | 37.0% |
| Aug-2013 | 37.9% |
| Sep-2013 | 36.9% |
| Oct-2013 | 36.1% |
| Nov-2013 | 37.3% |
Source: Author's analysis of Bureau of Labor Statistics Current Population Survey public data series
Federal unemployment insurance benefit extensions are set to expire at the end of this month. It would be unprecedented for unemployment insurance benefits to expire at a time when the long-term unemployment rate remains so elevated. The long-term unemployed as a share of the labor force sits at 2.6 percent. Historically, unemployment insurance benefits have only been allowed to expire when this rate was 1.3 percent or lower.
Furthermore, it is bad policy. If the extensions are allowed to expire, it will immediately cause more than 1.3 million people to lose their unemployment benefits, and millions more will lose their benefits throughout 2014. Not only will this hurt workers, but unemployment insurance is one of the best economic stimulators. If the unemployment insurance extensions expire, the labor market is estimated to lose 310,000 jobs in 2014.
3. High unemployment continues to plague all demographic and occupational groups
The table below shows the current unemployment rate and the unemployment rate in 2007, along with the ratio of those two values, for various demographic and occupational categories. There is currently substantial variation in unemployment rates across groups, as is always the case. A key message from this table is that the unemployment rate is between 1.3 and 1.8 times as high now as it was six years ago for all groups. Today’s sustained high unemployment relative to 2007 across all age, education, occupation, gender, and racial and ethnic groups underscores that the jobs crisis stems from a broad-based lack of demand. In particular, unemployment is not high because workers lack adequate education or skills; rather, a lack of demand for goods and services makes it unnecessary for employers to significantly ramp up hiring.
Unemployment rates of various demographic groups, 2007 and today
| 2007 | November 2013 | Ratio | |
|---|---|---|---|
| All | 4.6 | 7.0 | 1.5 |
| Male | 4.7 | 7.3 | 1.6 |
| Female | 4.5 | 6.7 | 1.5 |
| White | 4.1 | 6.2 | 1.5 |
| Black | 8.3 | 12.5 | 1.5 |
| Hispanic | 5.6 | 8.7 | 1.6 |
| Age 16–24 | 10.5 | 14.1 | 1.3 |
| Age 25–54 | 3.7 | 6.2 | 1.7 |
| Age 55+ | 3.1 | 4.9 | 1.6 |
| Workers age 25 and older | |||
| Less than high school | 7.1 | 10.8 | 1.5 |
| High school | 4.4 | 7.3 | 1.7 |
| Some college | 3.6 | 6.4 | 1.8 |
| Bachelor’s and advanced degree | 2.0 | 3.4 | 1.7 |
| Workers under age 25, not enrolled in further schooling | |||
| High school degree | 12.0 | 19.2* | 1.6 |
| Bachelor’s and advanced degree | 5.4 | 8.3* | 1.5 |
| Occupation | |||
| Management, professional, and related occupations | 2.1 | 3.7* | 1.7 |
| Service occupations | 5.9 | 8.7* | 1.5 |
| Sales and office occupations | 4.3 | 7.2* | 1.7 |
| Construction and extraction occupations | 7.6 | 12.7* | 1.7 |
| Installation, maintenance, and repair occupations | 3.4 | 5.5* | 1.6 |
| Production, transportation, and material moving occupations | 5.8 | 9.2* | 1.6 |
* This is a 12-month average (December 2012–November 2013), since this series is not seasonally adjusted.
Source: Author's analysis of the Current Population Survey public data series
— With research assistance from Hilary Wething, Alyssa Davis, and Will Kimball