
Full Report
Policymakers and researchers often see working longer as a solution for workers who cannot afford to retire. Underlying this thinking is an assumption that as workers age and gain more work experience, they are able to transition into jobs that are less physically demanding, less onerous, and less hazardous—making it possible to extend their working lives. However, as this report shows, many workers in fact see little or no improvement in working conditions as they age.
This is the first of two reports on older workers’ responses to the American Working Conditions Survey (RAND Corporation 2015, 2018). This report focuses on six categories of working conditions that are considered onerous or dangerous for workers, and that may be even more so for older workers:
- Physical demands, such as moving heavy loads or people (Figure A)
- Environmental hazards or burdens, such as exposure to chemicals or infectious materials (Figure B)
- Difficult schedules, such as shift work or last-minute scheduling (Figure C)
- High pressure, such as working to tight deadlines or at very high speeds (Figure D)
- Low control over work decisions, such as the order of tasks or timing of breaks (Figure E)
- Adverse social interactions, such as threats or violence (Figure F)
The analysis in this report suggests that roughly half of older workers ages 50–70 experience each of these categories of difficult working conditions, with the exception of adverse social interactions (which affect less than 15% of older workers). The average older worker experiences 2.6 of these categories.
Quantifying the large share of older workers with difficult jobs serves as a reality check for policymakers and researchers who view later retirement as an easy way for workers to close retirement income gaps.
A second EPI report will focus on how well, or how poorly, employers are meeting the needs of older workers in terms of job satisfaction, hours, pay and benefits, future job prospects, and preparing for retirement. The second report is intended to help inform discussions around older worker recruitment and retention at a time when workers age 50 and older make up a third of the workforce, the highest share on record, yet were disproportionately likely to exit during the pandemic.1
Both reports are companions to the Older Workers and Retirement Chartbook, a joint project of the Economic Policy Institute and the Schwartz Center for Economic Policy Analysis (Morrissey, Radpour, and Schuster 2022). Among other things, the chartbook documents that 31.6% of workers ages 55–64 and 24.1% of workers age 65 and older have physically demanding jobs.2 The current report builds on these findings using a different survey (the American Working Conditions Survey) and a broader array of working conditions.
Synopsis
Findings: Significant shares of older workers ages 50–70 experience difficult working conditions. These include physical demands (50.3%), environmental hazards (54.2%), difficult schedules (53.7%), high-pressure jobs (46.1%), limited autonomy (45.9%), and adverse social interactions (14.1%).
Implications: Policymakers and researchers often assume that older workers who do not have the financial means to retire can simply continue working. But for many, working into old age is not a sustainable option. This is particularly true for those whose working conditions put them at higher risk as they age.
Recommendations: To close the retirement income gap that older workers too often face, we need to support workers’ ability to work toward a secure retirement, especially during their prime working years. This includes:
-
- pursuing full-employment macroeconomic policies;
- providing more support for workers with caregiving responsibilities;
- ensuring that all jobs come with benefits that lead to a secure retirement, most importantly by expanding Social Security; and
- improving working conditions for all workers through collective bargaining, stronger labor standards, and more effective health and safety protections.
Background and related research
It has been extensively documented that the life expectancy of lower-paid, blue-collar, or non-college-educated workers is shorter than that of higher-paid, white-collar, or college-educated workers, and that these gaps have widened in recent decades.3 Some of these gaps reflect physical demands and workplace hazards that many lower-paid workers are exposed to. Workplace stressors such as poor work-life balance and a lack of autonomy are also more widespread among lower-paid workers and are linked to poor health, disability, and premature death. However, lack of access to medical care, behavioral risks such as smoking, and other factors correlated with low socioeconomic status also negatively affect health, making it challenging to isolate the effects of difficult working conditions.4
This report builds on earlier research documenting working conditions experienced by older workers, including reports from the Center for Economic and Policy Research (CEPR) that link older workers’ occupations with physically demanding and onerous working conditions documented in the Occupational Information Network (O*NET) (Rho 2010; Bucknor and Baker 2016). CEPR’s 2016 study, focusing on a somewhat older age group than this report, found that 34.5% of workers age 58 and older had physically demanding jobs; 22.1% of these older workers had jobs with difficult working conditions; and 43.8% had jobs that met one or both of these criteria in 2014. Though the metrics in the current report are not directly comparable with those in the CEPR reports, they corroborate the CEPR findings that many older workers have onerous or hazardous jobs.
Some workers do leave physically demanding jobs as they get older, either transitioning to less physical jobs or leaving the workforce entirely, often due to poor health. Thus, for example, between 2003 and 2018, there was a small decline in the number of construction laborers among the 1954–1968 birth cohort despite rapid growth in that occupation. As a result, workers ages 50–64 in 2018 made up 20.6% of that occupation, less than their 26.9% share of the workforce.5
This is not true of all physically demanding occupations, however. Between 2003 and 2018, the number of personal and home care aides more than doubled among the 1954–1968 birth cohort. While this also reflects a rapid growth in that occupation, prime-age workers ages 35–49 were slightly underrepresented in this occupation in 2003, while older workers ages 50–64 were slightly overrepresented in 2018, making up 30.8% of the occupation and 26.9% of the overall workforce.
A related occupation—nursing, psychiatric, and home health aides—was also slightly overrepresented among workers ages 50–64 in 2018 (28.2% vs. 26.9%).6 These aides—overwhelmingly women, workers of color, and immigrants—perform essential work for extremely low pay that does not compensate for the risks they face (Dorman and Boden 2021; Robertson, Sawo, and Cooper 2022). Home health aides, for example, are at high risk of overexertion and falling injuries because their job often involves moving patients without assistance or proper equipment (AIHA 2021).
How do older workers’ jobs compare with prime-age workers’ jobs?
With many more years of experience, we might expect older workers to have better jobs than prime-age workers—and they do, on average. However, the differences are smaller than might be expected, and many older workers remain in difficult jobs.
As is discussed in more detail later in this report, older workers ages 50–70 are less likely than prime-age workers ages 35–49 to have demanding schedules, work under high pressure, or experience adverse social interactions. Older workers are also less likely than prime-age workers to have physically demanding jobs or be exposed to uncomfortable or hazardous environments; however, these differences are often small and statistically insignificant. Older workers are about as likely as prime-age workers to have little control over work decisions, which can contribute to stress and poor health.
Of the six categories of difficult working conditions discussed in this report, older workers experience on average 2.6 of them, while prime-age workers experience 3.1.
Any advantages enjoyed by older workers stem from the fact that some workers move to better jobs as they gain skills and experience, while workers in poor health or with bad jobs are more likely to exit the workforce. In addition, some older workers consider themselves semi-retired but transition to easier, often part-time, “bridge” jobs. Though older workers may be less likely than prime-age workers to have physically taxing or hazardous jobs, difficult working conditions combined with declining health put older workers at greater risk for serious injuries.
How do older U.S. workers fare compared with older European workers?
Throughout this report, we share data on working conditions faced by older European workers as a point of comparison.
By some measures, older European workers appear to have less physically demanding jobs and less demanding schedules than their U.S. counterparts. They are about as likely as older U.S. workers to be exposed to potentially hazardous environmental conditions, have high-pressure jobs, or experience adverse social interactions. They appear more likely than older U.S. workers to say they have little control over their work.
These comparisons should be approached with caution, though, because the European survey was fielded three years before the U.S. survey, covers a somewhat wider age range, and does not include all the questions from the U.S. survey selected for this report. (See the technical note.)
Technical note
Unless otherwise noted, “prime-age” refers to workers ages 35–49, and “older” refers to workers age 50 and older, following the conventions used with the American Working Conditions Survey (Maestas et al. 2017) and the European Working Conditions Survey (Parent-Thirion et al. 2016). However, because the U.S. survey includes very few workers older than 70, these workers were dropped from the U.S. sample, which is limited to workers ages 50–70. In references to European workers, however, “older workers” includes all workers age 50 and older. Though the two age groups are not strictly comparable, workers age 71 or older make up a small share of the older workforce in both the United States and the European Union.
Unless otherwise noted, U.S. statistics cited in this report are based on Economic Policy Institute analysis of microdata from the second American Working Conditions Survey fielded in 2018 (RAND Corporation 2018). European statistics were taken from charts on the website of the European Foundation for the Improvement of Living and Working Conditions based on the sixth European Working Conditions Survey fielded in 2015 (Eurofound n.d.). European statistics are for the 28 countries that were members of the European Union in 2015. More recent European data, based on a special telephone survey fielded in 2021, were made available after research for this report was completed. However, results from this later survey, taken during the COVID-19 pandemic, may not be useful for comparing U.S. and European workers under normal economic conditions.
Differences noted in the report are statistically significant unless otherwise noted. That is, statistics for prime-age U.S. workers or older European workers are outside the 95% confidence interval for statistics for older U.S. workers.
Half of older workers have physically demanding jobs
As shown in Figure A, half (50.3%) of older workers engage in at least one physical activity that can lead to injury. These include carrying or moving heavy loads, lifting or moving people, or working in tiring or painful positions at least a quarter of the time. Prime-age workers are more likely to engage in these activities (55.5%), but the difference between the two age groups is fairly small.
Many older workers have physically demanding jobs: Share of workers with physical demands at work by age, 2018
| Age | Prime-age workers (35–49) | Older workers (50–70) |
|---|---|---|
| Any physical demand | 55.5% | 50.3% |
| Carrying or moving heavy loads | 43.3% | 36.1% |
| Lifting or moving people | 21.5% | 15.6% |
| Tiring or painful positions | 44.1% | 36.9% |

Note: Workers were asked whether their main paid job involved carrying or moving heavy loads, lifting or moving people, or working in tiring or painful positions a quarter of the time or more.
Source: Author’s analysis of 2018 American Working Conditions Survey microdata (RAND Corporation 2018).
More older workers might be considered to have physically demanding jobs if we included those who stand all or almost all the time at work, but this question was not included in the 2018 American Working Conditions Survey. In 2015, 29.3% of older workers had jobs that entailed standing all or almost all the time. Including these workers, 56.2% of older workers had physically demanding jobs in 2015, whereas the share of older workers in physically demanding jobs was 50.3% in 2015 if standing is not included.7
Older European workers are less likely than older U.S. workers to have jobs that involve carrying heavy loads (29% vs. 36.1%) or lifting or moving people (9% vs. 15.6%). However, older European workers are more likely than older U.S. workers to say they work in tiring or painful positions (43% vs. 36.9%).8
Moving heavy loads or people and working in tiring or painful positions takes a toll on workers’ musculoskeletal systems over time, especially if actions are done repeatedly and in awkward positions. Musculoskeletal disorders are the largest category of Social Security Disability Insurance awards among adults (SSA 2022, Chart 6). Workers in physically demanding occupations also face greater accident risk (Abdalla et al. 2017).
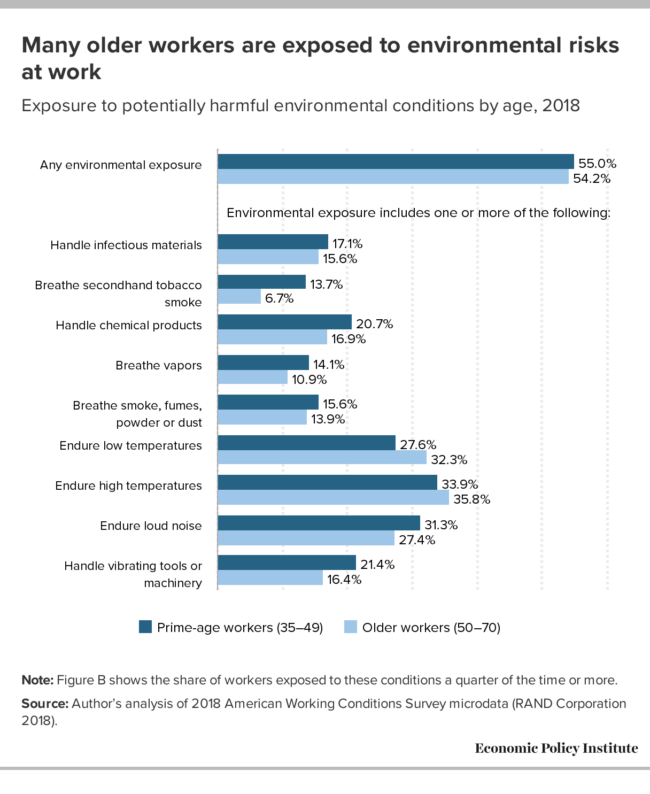
More than half of older workers are exposed to negative environmental conditions
As shown in Figure B, over half of older workers (54.2%) are exposed to at least one unpleasant, unhealthy, or potentially hazardous condition in their physical work environment at least a quarter of the time, about the same share as prime-age workers (55.0%). Older workers are less likely than prime-age workers to breathe secondhand tobacco smoke, handle chemicals, breathe vapors, be exposed to loud noise, or be exposed to vibrations. They are more likely to be exposed to low temperatures. Differences in exposure to infectious materials, smoke and fumes, or high temperatures are not statistically significant.
Many older workers are exposed to environmental risks at work: Exposure to potentially harmful environmental conditions by age, 2018
| Age | Prime-age workers (35–49) | Older workers (50–70) |
|---|---|---|
| Any environmental exposure | 55.0% | 54.2% |
| Handle infectious materials | 17.1% | 15.6% |
| Breathe secondhand tobacco smoke | 13.7% | 6.7% |
| Handle chemical products | 20.7% | 16.9% |
| Breathe vapors | 14.1% | 10.9% |
| Breathe smoke, fumes, powder or dust | 15.6% | 13.9% |
| Endure low temperatures | 27.6% | 32.3% |
| Endure high temperatures | 33.9% | 35.8% |
| Endure loud noise | 31.3% | 27.4% |
| Handle vibrating tools or machinery | 21.4% | 16.4% |
Note: Figure B shows the share of workers exposed to these conditions a quarter of the time or more.
Source: Author’s analysis of 2018 American Working Conditions Survey microdata (RAND Corporation 2018).
By most measures, older European and U.S. workers are about equally likely to be exposed to potentially harmful physical environments: 13% of older European workers handle infectious materials (compared with 15.6% of older U.S. workers); 7% breathe secondhand tobacco smoke (vs. 6.7%); 17% handle chemical products (vs. 16.9%); 10% breathe vapors (vs. 10.9%); 15% breathe fumes, powder, or dust (vs. 13.9%); 26% are exposed to loud noise (vs. 27.4%); and 19% handle vibrating tools or machinery (vs. 16.4%). None of these differences are statistically significant. Older European workers are, however, less likely to be exposed to low temperatures (22% compared with 32.3%) or high temperatures (23% vs. 35.8%).9
Unfortunately, the American Working Conditions Survey does not ask about working conditions that increase the risk of many types of accidents, such as falls. Workplace hazards interact with health factors such as worsening vision, hearing, reflexes, and balance to increase the risk of accidents that put many older workers in grave danger. Older workers also suffer more serious consequences than younger workers from incidents such as falls and are overrepresented in some dangerous occupations, such as farming (CPWR et al. 2009; National Research Council and Institute of Medicine 2004; Smith and Pegula 2020).
Even if older workers face less hazardous working conditions than other workers, these hazards can have more serious repercussions for older workers. For example, while older workers may be less likely than other workers to be killed falling from heights, presumably because they are less likely to work in construction trades and other occupations in which the risk of these injuries is elevated, they are more likely to be killed from falls on the same level (Rogers and Wiatrowski 2005).
Because older workers tend to suffer more serious injuries than younger workers from similar incidents, workers 65 and older are more than twice as likely as workers as a whole to suffer fatal workplace injuries: 8.4 deaths per 100,000 full-time-equivalent (FTE) workers versus an average of 3.6 deaths per 100,000 FTE workers overall in 2021 (BLS 2022). Workers ages 55–64 have the next-highest fatality rate (4.6 deaths per 100,000 FTE workers).
Based on a measure that tracks occupational injuries and illnesses resulting in days away from work, nonfatal occupational injury and illness rates declined across age groups between 2011 and 2019 before spiking in 2020 due to the pandemic. However, the decline was steeper for younger workers than for older workers, who in earlier years typically had fewer—albeit more serious—nonfatal injuries and illnesses (BLS 2023a; Rogers and Wiatrowski 2005; CDC 2011). In 2019, injury and illness rates for workers ages 45–54, 55–64, and 65 and older were 98.3, 109.1, and 98.3 injuries or illnesses per 10,000 full-time-equivalent workers, respectively, compared with an overall average rate of 94.8 (BLS 2023a). These injuries and illnesses also resulted in more time off work: The median number of days lost from a nonfatal work injury or illness was 12, 14, and 15 days for workers ages 45–54, 55–64, and 65 and older, respectively, compared with an overall median of 9 days (BLS 2023b).
The Bureau of Labor Statistics does not track fatal occupational illnesses. However, the available evidence suggests that health vulnerabilities and occupational exposure appear to have made the COVID-19 pandemic especially deadly for some older workers. While some occupations with high COVID-19 mortality rates—such as food preparation and serving occupations—employ relatively young workers, other occupations have high mortality rates due to a combination of age and exposure risk factors. These doubly dangerous occupations are: building and grounds cleaning and maintenance; community and social services; installation, maintenance, and repair; and production occupations (a broad category that includes most manufacturing and food processing occupations).10
Another indication that older workers have been especially vulnerable during the pandemic is that total nonfatal illness and injury rates increased nearly as fast between 2019 and 2020 for workers ages 45–54 (31.9%) and ages 55–64 (30.6%) as the overall average (34.2%) (BLS 2023a). Since much or all of the increased incidence was probably due to the pandemic, these estimates can serve as a rough indicator of the likelihood of COVID-19 exposure. Since overall COVID-19 mortality rates for older age groups are up to 25 times11 that of the 18–29 age group that serves as a reference, these older workers likely died at greater rates from COVID-19 exposure on the job (CDC 2023). Though nonfatal illness and injury rates increased more slowly between 2019 and 2020 for workers 65 and older (9.7%) than for other workers (BLS 2023a), likely due to a jump in retirements among older workers in occupations characterized by high physical proximity to others (Davis 2021), the COVID-19 mortality rate for people age 65 and older is at least 65 times that of people ages 18–29 (CDC 2023).
Half of older workers have difficult schedules
As shown in Figure C, half of older workers (53.7%) and two-thirds of prime-age workers (66.1%) report at least one indicator of a difficult or precarious work schedule. Fewer older workers than prime-age workers say that poor work-life balance causes their work to interfere with family or social commitments; that their employer engages in last-minute (day-before or same-day) scheduling; that they usually work 48 or more hours per week at their main job; that they worked at night at least once in the past month; or that they work shifts.12
Many older workers have difficult schedules: Work-life balance and work schedules by age, 2018
| Age | Prime-age workers (35–49) | Older workers (50–70) |
|---|---|---|
| Any type of difficult schedule | 66.1% | 53.7% |
| Poor work-life balance | 15.8% | 11.8% |
| Last-minute scheduling | 22.6% | 9.2% |
| Work more than 48 hours/week | 24.2% | 16.6% |
| Night work | 31.8% | 24.5% |
| Shift work | 32.2% | 26.5% |
Notes: Workers with poor work-life balance are those who say their working hours fit “not very well” or “not at all well” with family or social commitments. Workers with last-minute scheduling are those whose work schedules are often set the day before or the same day they are expected to work.
Workers with poor work-life balance are those who say their working hours fit “not very well” or “not at all well” with family or social commitments. Workers with last-minute scheduling are those whose work schedules are often set the day before or the same day they are expected to work. The share of workers working more than 48 hours per weeks is based on the hours they usually work at their main job. Workers who work nights are those who work at least two hours between 10 p.m. and 5 a.m. at least once per month. Workers who work shifts are based on a question that included other scheduling arrangements, such as working fixed starting and finishing times. Though the survey did not define shift work, this is usually understood to mean round-the-clock work divided into two or three shifts, such that some work is done outside of daytime hours.
Source: Author’s analysis of 2018 American Working Conditions Survey microdata (RAND Corporation 2018).
Older European workers appear to have less demanding schedules than their U.S. counterparts, with 16% reporting night work (compared with 24.5% of older U.S. workers) and 16% reporting shift work (vs. 26.5%).13 Older European workers are also less likely to have worked at least one 10+ hour day in the past month (31% vs. 52.5%) (indicator not shown in Figure C).
Studies have found links between long hours, shift work, poor work-life balance, and poor health (Goh, Pfeffer, and Zenios 2015). Irregular schedules common in the service sector are associated with psychological distress, poor sleep, work-family conflict, and economic insecurity among older workers (Abrams, Harknett, and Schneider 2022). For workers paid by the hour, irregular schedules not only affect work-life balance but also make incomes unpredictable and contribute to stress, poor sleep, and other negative health outcomes (Harknett and Schneider 2020). Last-minute scheduling exacerbates the uncertainty of irregular hours and makes it difficult for workers to take on other work.
Night shift work is also harmful to workers’ health. It is linked to risk factors for heart disease, diabetes, stroke, and other serious health problems (Cheng et al. 2021), compounding health risks that increase with age. Though the American Working Conditions Survey does not differentiate between overnight shifts and earlier shifts or evening work, 7.9% of older workers and 10.8% of prime-age workers report both working nights and working shifts (not shown in Figure C).
Nearly half of older workers have high-pressure jobs
As shown in Figure D, nearly half of older workers (46.1%) have at least one indicator of a high-pressure job, though this share is less than the share of prime-age workers who report the same (63.6%). Fewer older workers than prime-age workers say they deal with frequent negative disruptions, that they usually do not have enough time to finish their work, that they work to tight deadlines all or almost all the time, or that they work at very high speeds all or almost all the time.
Many older workers have high-pressure jobs: Indicators of high-pressure jobs by age, 2018
| Age | Prime-age workers (35–49) | Older workers (50–70) |
|---|---|---|
| Any indicator of a high-pressure job | 63.6% | 46.1% |
| Frequent disruptions | 26.0% | 17.8% |
| Not enough time to finish work | 33.0% | 19.7% |
| Tight deadlines | 39.8% | 27.0% |
| Very high speed | 31.8% | 19.1% |
Notes: Workers who experience frequent disruptions are those who say they “fairly” or “very” often interrupt a task in order to take on an unforeseen task and who describe these interruptions as at least somewhat negative.
Workers who experience frequent disruptions are those who say they “fairly” or “very” often interrupt a task in order to take on an unforeseen task and who describe these interruptions as at least somewhat negative. Workers who do not have enough time to finish their work are those who “sometimes,” “rarely,” or “never” have enough time, excluding those who say they “always” or “most of the time” have enough time to complete tasks. Workers who work to tight deadlines or at very high speed are those who say they experience these pressures “all” or “almost all” the time.
Source: Author’s analysis of 2018 American Working Conditions Survey microdata (RAND Corporation 2018).
Older European workers are about as likely as older U.S. workers to report frequent negative disruptions (15% vs. 17.8%); to work to tight deadlines all or almost all the time (24% vs. 27.0%); or to work at very high speeds all or almost all the time (19% vs. 19.1%). None of these differences are statistically significant. Older European workers are more likely than older U.S. workers to say that they usually do not have enough time to finish their work (26% vs. 19.7%).
High-pressure jobs are “risk multipliers,” to quote a report on the high injury and illness rates experienced by Amazon warehouse workers (Berkowitz and Athena Coalition 2020; Greene and Alcantara 2021). Amazon warehouse workers trying to meet demanding quotas were among the older workers whose on-the-job injuries are vividly described in the book Nomadland (Bruder 2017). Amazon delivery drivers also suffer high injury rates linked to high-pressure delivery quotas (SOC 2022). Meat processing, which employs many older workers, is another industry in which speed has been linked to high injury rates (Gremillion and Berkowitz 2019; Human Rights Watch 2019; GAO 2016).
Nearly half of older workers have limited control over their work
As shown in Figure E, nearly half of older workers (45.9%) report at least one indicator of low job control, a share not significantly different from that of prime-age workers (47.9%). Older workers are somewhat less likely to say they lack control over break times or work speed and somewhat more likely to say they lack control over work methods. For other indicators, differences between the two age groups are not statistically significant.
Many older workers have little autonomy at work: Indicators of limited job control by age, 2018
| Age | Prime-age workers (35–49) | Older workers (50–70) |
|---|---|---|
| Any indicator of limited job control | 47.9% | 45.9% |
| Little choice in when to take breaks | 21.1% | 17.6% |
| Little influence on decisions important to work | 20.1% | 18.0% |
| No choice in work speed | 23.3% | 19.0% |
| No choice in work methods | 20.4% | 25.2% |
| No choice in task order | 22.1% | 23.0% |
Notes: The shares of workers with little choice in when to take breaks and little influence on decisions important to their work are those who said they “rarely” or “never” had such a choice or influence.
The shares of workers with little choice in when to take breaks and little influence on decisions important to their work are those who said they “rarely” or “never” had such a choice or influence. The shares with no choice in work speed, work methods, or task order were those who answered “no” to a question about whether they were able to choose or change these aspects of their jobs.
Source: Author’s analysis of 2018 American Working Conditions Survey microdata (RAND Corporation 2018).
Older European workers appear to have less autonomy than older U.S. workers: 28% say they rarely or never choose break times, compared with 17.6% of older U.S. workers; 24% (vs. 18.0%) say they rarely or never influence decisions important to their work; 25% (vs. 19.0%) say they have no choice in work speed; 27% (vs. 25.2%) say they have no choice in work methods; and 29% (vs. 23.0%) say they have no choice in the order of tasks.
In a discussion about how long it is reasonable to expect workers to continue working at older ages, autonomy may seem less important than, say, risk of injury. However, a positive association between job control and health has been documented since the influential “Whitehall” studies of British civil servants in the 1970s.14 Though it is not surprising that higher-status workers (who tend to have more control over their work) are also healthier than lower-status workers (who tend to have less control), there is some evidence that the relationship between job control and health is causal and not simply a function of socioeconomic status. However, the relationship may vary by type of worker (blue-collar or white-collar) and other factors, such as whether a low-control job is also highly demanding.
Many older workers experience adverse social interactions at work
Older workers are less likely than prime-age workers to be on the receiving end of abusive and violent behavior (14.1% vs. 24.4%), though many still endure bullying, humiliation, threats, and verbal abuse on the job. As shown in Figure F, older workers are less likely than prime-age workers to say that they endured sexual harassment or bullying in the past 12 months or that they endured threats, unwanted sexual attention, or verbal abuse in the past month. Differences between the two age groups in exposure to physical violence in the past 12 months or humiliating behavior in the past month are not statistically significant.
Many older workers suffer abuse on the job: Adverse social interactions by age, 2018
| Age | Prime-age workers (35–49) | Older workers (50–70) |
|---|---|---|
| Any adverse social interaction | 24.4% | 14.1% |
| Sexual harassment | 3.0% | 0.6% |
| Bullying | 10.9% | 6.4% |
| Physical violence | 1.8% | 1.1% |
| Humiliating behavior | 7.3% | 6.2% |
| Threats | 7.9% | 4.3% |
| Unwanted sexual attention | 3.3% | 1.0% |
| Verbal abuse | 15.5% | 8.0% |
Notes: Workers who experience sexual harassment, bullying, or physical violence are those who experienced these abuses in the past 12 months. Workers who experience humiliating behavior, threats, unwanted sexual attention, or verbal abuse are those who experienced these abuses in the past month.
Source: Author’s analysis of 2018 American Working Conditions Survey microdata (RAND Corporation 2018).
European workers age 50 and older and U.S. workers ages 50–70 are about equally likely to be subject to any of these adverse social interactions (13% vs. 14.1%).
When we look at data on injuries intentionally inflicted on workers that are serious enough to result in days away from work, we see that workplace violence has been a growing problem in recent years. These injuries increased from 2.8 per 10,000 full-time-equivalent workers in 2011 to 3.6 per 10,000 FTE workers in 2019. The rate of intentional injuries dipped to 3.3 per 10,000 FTE workers in 2020, likely due to increased remote work during the COVID-19 pandemic. Rates for older workers also trended up during the 2011–2019 period, though older workers are generally less likely to be the targets of violence. In the last pre-pandemic year (2019), intentional injury rates for workers ages 45–54, 55–64, and 65+ were 3.2, 3.1, and 2.0 per 10,000 FTE workers, respectively, as compared with an overall average of 3.6 per 10,000 FTE workers (BLS 2023c).
The Bureau of Labor Statistics has only been tracking intentional injuries since 2011. Another measure of nonfatal workplace violence, based on a survey of crime victims and not limited to incidents resulting in missed work, suggests that workplace violence was more prevalent in the mid-1990s than it is today but shows a recent increase (Harrell et al. 2022, Figure 4.1). Workplace homicides were also higher in the mid-1990s and, unlike nonfatal attacks, have been relatively flat in recent years. Homicides accounted for 8–10% of fatal occupational injuries in 2011–2019 (BLS 2023c; Harrell et al. 2022, Figure 1.2).
Among broad occupation groups, medical, mental health, law enforcement, and security occupations suffer the highest rates of violent injury (Harrell et al. 2022, Table 5.2). Specific occupations that are often targeted and employ an older workforce include doctors, nurses, mental health practitioners and social workers, special education teachers, bus drivers, and taxi drivers.15
News reports suggest that the pandemic and social divisions may have intensified abuse aimed at workers, especially in medical settings. However, there is limited survey data on abuses that stop short of physical violence, and data for the pandemic years is just now starting to become available.
Discussion
In comparing reporting of working conditions between prime-age and older workers, it can be useful to keep in mind that these reflect differences between generations as well as changes workers experience over the course of their working lives. Generational and age differences, as well as cultural and societal differences between workers in the United States and in Europe, may also influence how these different groups experience similar working conditions. In other words, what one worker might find burdensome another might see as normal.
For example, in Albania, few workers report being exposed to adverse social behaviors such as verbal abuse, bullying, threats, or sexual harassment, according to the European Working Conditions Survey. In contrast, such negative social interactions appear common in the Netherlands, a far wealthier country (Parent-Thirion et al. 2017, Figure 51). Other surveys corroborate the finding that workers in high-income countries are more likely to say that they experience violence or harassment (ILO 2022). It is possible that Dutch coworkers or clients are more abusive than their Albanian counterparts. It is also possible that Albanian workers have fewer social interactions at work, that Albanian workers experiencing abuse are more reluctant to answer honestly or to complete the survey, or that some behavior that Albanian workers consider simply annoying Dutch workers consider abusive. More than one explanation could be true.
Differences in reporting can also reflect individual tastes. For example, some workers may enjoy the physical or mental challenges of a particular occupation, while others may find such work onerous.
In addition, some measures used in this report may not always be reliable indicators of difficult jobs even without subjective responses. For example, a grocery store cashier may have regular union-negotiated breaks and friendly coworkers who can cover in case of emergency. A delivery driver, on the other hand, may have difficulty taking rest breaks because of intense time pressure, but can decide for herself the timing of quick bathroom breaks based on access to facilities. In these scenarios, the grocery cashier has better working conditions when it comes to breaks and probably feels more in control at work than the harried delivery driver, but only the grocery cashier would be considered to have “low control” based on her inability to choose the timing of breaks. In other words, some measures of “low control” may reflect rules put in place to protect workers and ensure fairness, which might partly explain why older European workers, who are more likely to be represented by a union or similar body than older U.S. workers, are more likely to say they lack input on work-related decisions.16
Just as the timing of breaks may be an imperfect measure of job control, the connection between job control and well-being is also complicated. Nevertheless, low control and other aspects of work that can be gleaned from the American Working Conditions Survey can provide us with a more complete picture of the challenges facing older workers than focusing narrowly on physical demands and health-related work limitations. Some types of difficult working conditions may be imperfectly measured or poorly understood but are more harmful to workers than more easily quantifiable or better-known risks. It is likely, for example, that shift work and stress associated with police work have more of an impact on police officers’ life expectancy than the dangers normally associated with this occupation (Violanti et al. 2013; Ma et al. 2014).
Conclusion
By some measures, older workers are somewhat less exposed to physical risks and stressors than prime-age workers, consistent with the idea that some workers with difficult jobs, such as construction laborers, either transition to easier jobs or leave the workforce as they age. However, differences between prime-age and older workers are generally small, and roughly half of older workers endure physical demands, environmental hazards or burdens, difficult schedules, high pressure, or low control over their work. One in 7 older workers experience physical or verbal abuse on the job. The average older worker experiences 2.6 categories of difficult working conditions.
Workers who exit the workforce early often do so before they are ready to retire. The Older Workers and Retirement Chartbook documents that most workers who retire before age 65 do so involuntarily, with retirement preceded by poor health or disability; by a layoff, business closure, or ownership change; or by changes in working conditions or compensation.17
Though older workers’ exposure to risk might be slightly lower than that of prime-age workers, the repercussions are often much more serious. This is certainly true of accidental injuries and illnesses such as COVID-19, which are much more likely to be fatal for older workers. However, it is likely also true of many stressors that affect health, such as working nights.
While some occupations are clearly more dangerous than others as measured by injury rates, the wear and tear associated with physical labor, the cumulative impact of exposure to toxic substances, and the effects of other difficult working conditions are not always well documented but may contribute more to disability and premature death than accidents, though it can be challenging to differentiate between the effects of working conditions and socioeconomic status.18
The takeaway is that it is misguided and unrealistic to expect older workers with onerous or hazardous jobs to keep working into advanced old age. A better way to close the retirement income gap is to support workers’ ability to be fully employed during their prime working years and ensure that all jobs come with benefits that lead to a secure retirement. Ways to support workers include pursuing full-employment macroeconomic policies, providing more support for workers with caregiving responsibilities, and expanding Social Security. All workers would also be helped by stronger health and safety protections.
Acknowledgments
The author would like to thank RRF Foundation for Aging for its generous support of this project, Jori Kandra for timely and helpful research assistance, and Krista Faries for excellent editing.
Notes
1. EPI analysis of Current Population Survey microdata (Flood et al. 2022).
2. Based on data from the Health and Retirement Study, with non-college, Black, and Hispanic workers at even greater risk (Morrissey, Radpour, and Schuster 2022, Figures 1C and 1D).
3. See, for example, Waldron 2007; Rutledge 2018; Society of Actuaries 2019; Deeg, De Tavernier, and de Breij 2021.
4. For discussion of these factors, see Landsbergis, Grzywacz, and LaMontagne 2014; Clougherty, Souza, and Cullen 2010; Goh, Pfeffer, and Zenios 2015; Lovejoy et al. 2021; Pebley et al. 2021.
5. Author’s analysis of Current Population Survey microdata (Flood et al. 2022).
6. Author’s analysis of Current Population Survey microdata (Flood et al. 2022).
7. Author’s analysis of RAND Corporation 2015 microdata.
8. Author’s analysis of RAND Corporation 2018 and Eurofound n.d.; European statistics not shown in Figure A.
9. Author’s analysis of RAND Corporation 2018 and Eurofound n.d.; European statistics not shown in Figure B.
10. Author’s analysis of Billock, Steege, and Miñino 2022, Figure 1, and Current Population Survey data (Flood et al. 2022).
11. CDC data report that the COVID mortality rate for 50- to 64-year-olds is 25 times the mortality rate for 18- to 29-year-olds; for 40- to 49-year-olds, it is 10 times the rate.
12. Though the survey did not define shift work, it is usually understood to mean round-the-clock work divided into two or three shifts, such that some work is done outside of daytime hours.
13. Author’s analysis of RAND Corporation 2018 and Eurofound n.d.; European statistics not shown in Figure C.
14. Studies looking at the relationship between job control and health include Bosma et al. 1997; Clougherty, Souza, and Cullen 2010; Goh, Pfeffer, and Zenios 2015; Orton et al. 2019.
15. Author’s analysis of Current Population Survey microdata (Flood et al. 2022) and Harrell et al. 2022, Table 5.1.
16. Author’s analysis of RAND Corporation 2018 and Eurofound n.d.
17. See Morrissey, Radpour, and Schuster, Figures 1F, 1G, 1H, and 1I.
18. Studies analyzing causes of disability and premature mortality include Hummer and Hernandez 2013; Sabbath et al. 2013; Sewdas et al. 2019; de Wind et al. 2020; Roy et al. 2020; Schram et al. 2021; Boot et al. 2022.
Sources
Abdalla, Safa, Spenser S. Apramian, Linda F. Cantley, and Mark R. Cullen. 2017. “Chapter 6: Occupation and Risk for Injuries.” In Injury Prevention and Environmental Health, 3rd edition, edited by Charles N. Mock, Rachel Nugent, Olive Kobusingye, and Kirk R. Smith. The International Bank for Reconstruction and Development/The World Bank.
Abrams, Leah R., Kristen Harknett, and Daniel Schneider. 2022. “Older Workers with Unpredictable Schedules: Implications for Well-Being and Job Retention.” The Gerontologist 62, no. 10: 1443–1453.
American Industrial Hygiene Association (AIHA). 2021. Home Health Care Aides: Occupational Health and Safety Challenges and Opportunities. August 2021.
Berkowitz, Deborah, and Athena Coalition. 2020. Packaging Pain: Workplace Injuries in Amazon’s Empire. National Employment Law Project, January 2020.
Billock, Rachael M., Andrea L. Steege, and Arialdi Miniño. 2022. “COVID-19 Mortality by Usual Occupation and Industry: 46 States and New York City, United States, 2020.” National Vital Statistics Reports 71, no. 6.
Boot, Cécile R.L., Ranu Sewdas, Emiel O. Hoogendijk, Dorly J.H. Deeg, Allard J. van der Beek, and Astrid de Wind. 2022. “Disability Free Life Expectancy and Working Conditions.” Safety and Health at Work 13: S15.
Bosma, Hans, Michael G. Marmot, Harry Hemingway, Amanda C. Nicholson, Eric Brunner, and Stephen A. Stansfeld. 1997. “Low Job Control and Risk of Coronary Heart Disease in Whitehall II (Prospective Cohort) Study.” BMJ 314, no. 7080: 558.
Bruder, Jessica. 2017. Nomadland: Surviving America in the Twenty-First Century. W.W. Norton.
Bucknor, Cherrie, and Dean Baker. 2016. Still Working Hard: An Update on the Share of Older Workers in Physically Demanding Jobs. Center for Economic and Policy Research, March 2016.
Bureau of Labor Statistics (BLS). 2022. Rate of Fatal Work Injuries per 100,000 Full-Time Equivalent Workers by Age Group. Charts related to the December 16, 2022, “Census of Fatal Occupational Injuries” news release.
Bureau of Labor Statistics (BLS). 2023a. Nonfatal Cases Involving Days Away from Work: Injury and Illness Rate per 10,000 Full-Time Workers. Tables customized by selected age groups and downloaded from the BLS website March 2023.
Bureau of Labor Statistics (BLS). 2023b. Nonfatal Cases Involving Days Away from Work: Median Days Lost. Tables customized by selected age groups and downloaded from the BLS website March 2023.
Bureau of Labor Statistics (BLS). 2023c. Nonfatal Cases Involving Days Away from Work: Event—Intentional Injury by Other Person. Tables customized by selected age groups and downloaded from the BLS website March 2023.
Center for Construction Research and Training (CPWR), National Institute for Occupational Safety and Health (NIOSH), Association of Occupational and Environmental Health Clinics (AOEC), Society for Occupational and Environmental Health (SOEH), AARP, Work and Health Research Center, University of Maryland School of Nursing (WHRC), Occupational Safety and Health Administration (OSHA), and American Public Health Association (APHA). 2009. Healthy Aging for a Sustainable Workforce—A Conference Report. November 2009.
Centers for Disease Control and Prevention (CDC). 2011. Nonfatal Occupational Injuries and Illnesses Among Older Workers—United States, 2009. April 2011.
Centers for Disease Control and Prevention (CDC). 2023. “Risk for COVID-19 Infection, Hospitalization, and Death by Age Group.” Table accessed April 2023.
Cheng, Wan-Ju, Chiu-Shong Liu, Kai-Chieh Hu, Yu-Fang Cheng, Kati Karhula, and Mikko Härmä. 2021. “Night Shift Work and the Risk of Metabolic Syndrome: Findings from an 8-Year Hospital Cohort.” PLoS One 16, no. 12: e0261349.
Clougherty, Jane E., Kerry Souza, and Mark R. Cullen. 2010. “Work and Its Role in Shaping the Social Gradient in Health.” Annals of the New York Academy of Sciences 1186.1: 102–124.
Davis, Owen. 2021. “Employment and Retirement Among Older Workers During the COVID-19 Pandemic.” Schwartz Center for Economic Policy Analysis and Department of Economics, The New School for Social Research, Working Paper Series 2021-6.
Deeg, Dorly J.H., Wouter De Tavernier, and Sascha de Breij. 2021. “Occupation-Based Life Expectancy: Actuarial Fairness in Determining Statutory Retirement Age.” Frontiers in Sociology 6: 675618.
De Wind, Astrid, Ranu Sewdas, Emiel O. Hoogendijk, Allard J. van der Beek, Dorly J.H. Deeg, and Cécile R.L. Boot. 2020. “Occupational Exposures Associated with Life Expectancy Without and with Disability.” International Journal of Environmental Research and Public Health 17, no. 17: 6377.
Dorman, Peter, and Leslie I. Boden. 2021. Risk Without Reward: The Myth of Wage Compensation for Hazardous Work. Economic Policy Institute, April 2021.
European Foundation for the Improvement of Living and Working Conditions (Eurofound). n.d. European Working Conditions Survey – Data Visualisation (website). European bar charts based on 2015 European Working Conditions Survey, accessed March 2023.
Flood, Sarah, Miriam King, Renae Rodgers, Steven Ruggles, J. Robert Warren, and Michael Westberry. 2021. Integrated Public Use Microdata Series, Current Population Survey: Version 9.0. Minneapolis, Minn.: IPUMS, 2021.
Goh, Joel, Jeffrey Pfeffer, and Stefanos A. Zenios. 2015. “Workplace Stressors & Health Outcomes: Health Policy for the Workplace.” Behavioral Science & Policy 1, no. 1: 43–52.
Government Accountability Office (GAO). 2016. Additional Data Needed to Address Continued Hazards in the Meat and Poultry Industry. April 2016.
Greene, Jay, and Chris Alcantara. 2021. “Amazon Warehouse Workers Suffer Serious Injuries at Higher Rates Than Other Firms.” Washington Post, June 1, 2021.
Gremillion, Thomas, and Deborah Berkowitz. 2019. “Risking Food Safety, USDA Plans to Let Slaughterhouses Self-Police.” The Hill, September 17, 2019.
Harknett, Kristen, and Daniel Schneider. 2020. “Precarious Work Schedules and Population Health.” Health Affairs Health Policy Brief.
Harrell, Erika, Lynn Langton, Jeremy Petosa, Stephen M. Pegula, Mark Zak, Susan Derk, Dan Hartley, and Audrey Reichard. 2022. Indicators of Workplace Violence, 2019 (NCJ 250748; NIOSH 2022-124). Bureau of Justice Statistics, Office of Justice Programs, U.S. Department of Justice; Office of Safety, Health, and Working Conditions, Bureau of Labor Statistics, U.S. Department of Labor; and National Institute for Occupational Safety and Health, Centers for Disease Control and Prevention, U.S. Department of Health and Human Services.
Hummer, Robert A., and Elaine M. Hernandez. 2013. “The Effect of Educational Attainment on Adult Mortality in the United States.” Population Bulletin 68, no. 1: 1.
Human Rights Watch. 2019. “When We’re Dead and Buried, Our Bones Will Keep Hurting”—Workers’ Rights Under Threat in US Meat and Poultry Plants.
International Labour Organisation (ILO). 2022. Experiences of Violence and Harassment at Work: A Global First Survey.
Landsbergis, Paul A., Joseph G. Grzywacz, and Anthony D. LaMontagne. 2014. “Work Organization, Job Insecurity, and Occupational Health Disparities.” American Journal of Industrial Medicine 57, no. 5: 495–515.
Lovejoy, Meg, Erin L. Kelly, Laura D. Kubzansky, and Lisa F. Berkman. 2021. “Work Redesign for the 21st Century: Promising Strategies for Enhancing Worker Well-Being.” American Journal of Public Health 111: 1787–1795.
Ma, Claudia C., Michael E. Andrew, Desta Fekedulegn, Ja K. Gu, Tara A. Hartley, Luenda E. Charles, John M. Violanti, and Cecil M. Burchfiel. 2015. “Shift Work and Occupational Stress in Police Officers.” Safety and Health at Work 6, no. 1: 25–29.
Maestas, Nicole, Kathleen J. Mullen, David Powell, Till von Wachter, and Jeffrey B. Wenger. 2017. Working Conditions in the United States: Results of the 2015 American Working Conditions Survey. RAND Corporation.
Morrissey, Monique, Siavash Radpour, and Barbara Schuster. 2022. The Older Workers and Retirement Chartbook. Economic Policy Institute, November 2022.
National Research Council and Institute of Medicine. 2004. Health and Safety Needs of Older Workers. Washington, D.C.: National Academies Press.
Orton, Lois Catherine, Andy Pennington, Shilpa Nayak, Amanda Sowden, Mark Petticrew, Martin White, and Margaret Whitehead. 2019. “What Is the Evidence That Differences in ‘Control Over Destiny’ Lead to Socioeconomic Inequalities in Health? A Theory-Led Systematic Review of High-Quality Longitudinal Studies on Pathways in the Living Environment.” Journal of Epidemiology and Community Health 73, no. 10: 929–934.
Parent-Thirion, Agnès, Isabella Biletta, Jorge Cabrita, Oscar Vargas Llave, Greet Vermeylen, Aleksandra Wilczyńska, and Mathijn Wilkens. 2016. Sixth European Working Conditions Survey–Overview Report. European Foundation for the Improvement of Living and Working Conditions, November 17, 2016.
Pebley, Anne R., Noreen Goldman, Theresa Andrasfay, and Boriana Pratt. 2021. “Trajectories of Physical Functioning Among Older Adults in the US by Race, Ethnicity and Nativity: Examining the Role of Working Conditions.” PloS One 16, no. 3: e0247804.
RAND Corporation. 2015. American Working Conditions Survey [W01] [microdata].
RAND Corporation. 2018. American Working Conditions Survey [W02] [microdata].
Rho, Hye Jin. 2010. Hard Work? Patterns in Physically Demanding Labor Among Older Workers. Center for Economic Policy Research, August 2010.
Robertson, Cassandra, Marokey Sawo, and David Cooper. 2022. All States Must Set Higher Wage Benchmarks for Home Health Care Workers. Economic Policy Institute, June 2022.
Rogers, Elizabeth, and William J. Wiatrowski. 2005. “Injuries, Illnesses, and Fatalities Among Older Workers.” Monthly Labor Review, U.S. Bureau of Labor Statistics, October 2005.
Roy, Brita, Catarina I. Kiefe, David R. Jacobs, David C. Goff, Donald Lloyd-Jones, James M. Shikany, Jared P. Reis, Penny Gordon-Larsen, and Cora E. Lewis. 2020. “Education, Race/Ethnicity, and Causes of Premature Mortality Among Middle-Aged Adults in 4 US Urban Communities: Results From CARDIA, 1985–2017.” American Journal of Public Health 110, no. 4: 530–536.
Rutledge, Matthew S. 2018. What Explains the Widening Gap in Retirement Ages by Education? Center for Retirement Research Issue Brief #18-10.
Sabbath, Erika L., M. Maria Glymour, Alexis Descatha, Annette Leclerc, Marie Zins, Marcel Goldberg, and Lisa F. Berkman. 2013. “Biomechanical and Psychosocial Occupational Exposures: Joint Predictors of Post-Retirement Functional Health in the French GAZEL Cohort.” Advances in Life Course Research 18, no. 4: 235–243.
Schram, Jolinda L.D., Svetlana Solovieva, Taina Leinonen, Eira Viikari-Juntura, Alex Burdorf, and Suzan J.W. Robroek. 2021. “The Influence of Occupational Class and Physical Workload on Working Life Expectancy Among Older Employees.” Scandinavian Journal of Work, Environment & Health 47, no. 1: 5.
Sewdas, Ranu, Allard J. Van Der Beek, Cecile R.L. Boot, Stefania D’Angelo, Holly E. Syddall, Keith T. Palmer, and Karen Walker-Bone. 2019. “Poor Health, Physical Workload and Occupational Social Class as Determinants of Health-Related Job Loss: Results from a Prospective Cohort Study in the UK.” BMJ Open 9, no. 7: e026423.
Smith, Sean M., and Stephen M. Pegula. 2020. “Fatal Occupational Injuries to Older Workers.” Monthly Labor Review, U.S. Bureau of Labor Statistics, January 2020.
Social Security Administration (SSA). 2022. Annual Statistical Report on the Social Security Disability Insurance Program, 2021.
Society of Actuaries. 2019. Pri-2012 Private Retirement Plans Mortality Tables Report.
Strategic Organizing Center (SOC). 2022. The Worst Mile: Production Pressure and the Injury Crisis in Amazon’s Delivery System. May 2022.
Violanti, John M., Tara A. Hartley, Ja K. Gu, Desta Fekedulegn, Michael E. Andrew, and Cecil M. Burchfiel. 2013. “Life Expectancy in Police Officers: A Comparison with the US General Population.” International Journal of Emergency Mental Health 15, no. 4: 217.
Waldron, Hilary. 2007. “Trends in Mortality Differentials and Life Expectancy for Male Social Security-Covered Workers, by Socioeconomic Status.” Social Security Bulletin 67, no. 3.