Briefing Paper #77
Social Security, by almost any measure one of the most popular and successful government programs, has always had its share of detractors, but today the greater threat comes perhaps not from those who want to do away with it but from those who want to “fix” it. Although the program will have no problem paying all scheduled benefits for the next 34 years, a host of proposals have been put forward to ensure its solvency beyond the year 2032. All of them would cut benefits – by raising the retirement age, cutting the annual cost-of-living adjustment, or reducing mandated benefits – and most would shift a portion of Social Security payroll tax receipts into individual savings accounts, with associated increases in administrative costs. These plans, based on faulty assumptions about returns on investment, the accuracy of the consumer price index, and ability or desirability of pushing back the retirement age, have one thing in common: they would significantly reduce benefits for retirees.
A point often lost in the public discussion is that the Social Security program is basically sound by most measures. The long-term, 75-year projected shortfall that has prompted the intense public discussion and the various reform proposals is itself based on a set of pessimistic assumptions that need not come to pass. But if we want to address the shortfall, there are options that leave benefits as well as the fundamental structure of the program intact. One option, discussed in this paper, would include the following three steps:
(1) commit a portion of the federal government’s projected budget surpluses to the trust fund, or, alternatively, index the payroll tax to increases in life expectancy;
(2) fully incorporate the impact of recent changes to the consumer price index into the projections for the trust fund; and
(3) raise the cap on wages that are subject to the payroll tax so that it keeps in step with the upward distribution of income.
The following sections of this paper discuss this proposal in detail. The paper also examines the projections of the Social Security trustees and their underlying assumptions, and it takes a close look at the impact for retirees of three prominent, representative reform proposals: the National Commission on Retirement Policy plan; the Scheiber-Weaver plan, put forth by members of the president’s Advisory Council on Social Security; and the Moynihan-Kerrey plan.
The current forecast
Social Security has been an enormously successful program. Over the last 60 years it has lifted tens of millions of retired and disabled workers and their families out of poverty, and it provides the core income that allows workers to enjoy a dignified retirement without burdening their children or the public welfare. In contrast to many private sector insurance and retirement programs, Social Security achieves its goals with extremely low administrative expenses and few instances of fraud and abuse.
Moreover, current concerns about the program notwithstanding, Social Security is essentially sound. Unlike any other government program or spending category, Social Security must, by law, project its funding and expenses over a 75-year period. The latest projections show that the Social Security Trust Fund will be able to pay all scheduled benefits for the next 34 years. The fund is currently running a surplus of approximately $100 billion a year, which is invested in interest-paying U.S. government bonds. At the end of 1997 the fund had accumulated $655.5 billion in bonds (Social Security Administration (SSA) 1998, 105), which will earn $49.1 billion in interest in 1998 (SSA 1998, 104). The annual surpluses are projected to increase over the first decade of the next century, reaching $180.1 billion in 2010 (SSA 1998, 179),1 then diminish from 2011 to 2020 as most of the baby boom generation retires. In 2021 the program will begin drawing down its reserves, which, along with current revenue, will be sufficient to finance the retirement of the baby boomers through 2032. In that year the fund will be depleted and tax revenue will cover only 73% of scheduled benefits (Figure A). By the end of the projection period in 2075, with increasing life expectancies making for longer retirements, taxes are projected to cover less than 68% of benefits.

It is important to note that these projections of a long-range shortfall between taxes and benefits are based on a pessimistic assessment of the future. The Social Security trustees project that, because of limited population growth (brought on by low birth rates and restricted immigration) and persistent slow productivity growth, the economy will grow on average less than 1.7% a year through 2020 and less than 1.4% a year for the 55 years after that. By comparison, the economy has grown at an average rate of about 3.0% a year over the previous 75 years. But if population growth maintains its historic path or productivity growth approaches its pre-1973 rate (the trustees assume that the sluggish rates since 1973 will continue into the future), then much of the fund’s projected shortfall will disappear. For example, if productivity grows at a 2.0% annual rate – a pace still considerably below the 2.5% rate of the immediate postwar period – then one-third of the long-term shortfall will be eliminated. (The annual growth rate would have to rise to about 3.5% to eliminate the projected shortfall entirely.)
The source of the long-term problem
It is commonly accepted in the public discussions about Social Security that the retirement of the large baby boom generation will be the main source of pressure on the system in the future. This is not the case. Rather, the culprit behind the long-term shortfall is rising life expectancy. One of the benefits of improvements in living standards and medical technology is that people can expect to have longer and healthier lives now than in the past. In 1960, the life expectancy of a person after age 65 was just 14.4 years, meaning that they could expect to live to the age of 79.4. By 1990, this figure had risen to 17.0 years (life expectancy of 82.0), and it is expected to grow to 18.7 years in 2030 (life expectancy of 83.7) and to 20.6 years in 2075 (life expectancy of 85.6). These projected increases place a large burden on the Social Security fund because they lengthen significantly the amount of time that future generations are projected to receive benefits. For example, simply by living longer, people reaching age 65 in the year 2030 will receive 11% more in benefits than if life expectancies had remained at their 1990 level.2 The continued rise in life expectancy through the planning horizon will increase the per-person benefit payments by nearly 25% in 2075.
The current level of taxation, which will be largely sufficient to finance the retirement of the large baby boom cohort, will not be able to cover the cost of ever-lengthening retirements.3 This is the real demographic problem facing the Social Security system. As people live longer lives, they will either have to pay more in taxes during their working years, receive lower benefits during their retirement years, or retire later.
Three steps to achieving long-term balance
The Social Security trustees project that the total shortfall in the fund over the 75-year planning period is equal to 2.19% of payroll, meaning that, if the Social Security tax were raised tomorrow by 2.19 percentage points (1.095 percentage points for both the employee and employer), the fund would be able to pay all scheduled benefits over the next 75 years.
While this would represent a significant tax increase, it would be far from unprecedented. For example, the increase in military spending associated with the Korean War and the start of the Cold War was 8.3% of gross domestic product (Figure B). Education spending increased by 2.8% of GDP between 1946 and 1966 when the baby boomers were in school. In fact, Social Security actually increased by more as a share of GDP over the 35 years from 1960 to 1995 than it will increase over the 35 years from 1995 to 2030. In short, when it has been necessary to meet important public needs, the nation has repeatedly been willing and able to endure much larger burdens than that which Social Security will pose in the foreseeable future.

There are, however, good reasons not to close the Social Security shortfall through an immediate increase in the payroll tax. Because of growing wage inequality, the real wages of most of the workforce have actually declined over the last two decades. Workers who have been experiencing declining before-tax wages are ill-situated to cope with a new tax increase. Furthermore, the Social Security tax is regressive, since it falls only on wage income under $68,000.Workers do not pay Social Security taxes on wages above $68,000, and capital gains, interest, and dividend income are exempt from the Social Security tax altogether.
There are other ways besides payroll tax increases to correct the shortfall anticipated by the trustees. A simple plan is summarized in the box below.
THREE STEPS TO SAVING SOCIAL SECURITY
| Step | Plan | Revenue as % of payroll |
| 1 | commit a portion of the federal government’s projected budget surpluses to the Social Security trust fund or index the payroll tax to longevity. | 1.40% |
| 2 | fully incorporate in the projections the impact of the changes to the consumer price index (CPI) that have been made by Bureau of Labor Statistics (BLS) | .28% |
| 3 | raise the cap on the wages that are subject to the payroll tax so that it keeps in step with the upward distribution of income | .55% |
| Total revenue gain |
2.23% |
The first part of step 1 – committing a portion of the budget surplus to the trust fund – applies a principle on which there seems to be wide political agreement. President Clinton endorsed the idea in his 1998 State of the Union address, public opinion polls show widespread backing, and prominent Republicans in Congress have expressed their support. The cumulative budget surplus projected by the Congressional Budget Office (CBO) over its 10-year planning horizon is currently $1,611 billion. The surpluses rise over this period, reaching $251 billion in 2008, the last year in the projection. The entirety of the small surpluses in the early years can be applied to the Social Security fund, but then as the surplus grows beyond the needs of the Social Security system some of the projected surpluses can be used to finance public needs that were neglected in the era of deficit reduction. Since large surpluses can be expected to persist beyond 2008, this plan assumes that $190 billion a year from these surpluses will be used to support the Social Security trust fund through the year 2020. (The exact schedule of payments into the fund is described in the appendix.) The cumulative payments over this period will reduce the projected long-term shortfall in the fund by approximately 1.4% of payroll.
One objection to this proposal is that there is no guarantee that these surpluses will materialize. For example, the economy may go into a recession during the next few years, pushing the budget into a deficit. To avoid this problem, the federal government could commit to a schedule of payments independent of its fiscal position in any particular year; in other words, it could add the specified amount to the Social Security fund even if the surplus turned out not to be as large as anticipated. In these cases, the government would treat this obligation to the Social Security fund just as it would its planned spending for defense and education. If the resulting spending left the budget in a deficit (which economists usually consider desirable during an economic downturn), then the government could borrow to make up the shortfall. At present, the size of the U.S. government debt relative to its economy is by far the lowest of any major industrialized nation, suggesting that the government would face no problem borrowing in the foreseeable future if a downturn in the economy pushed the budget into a deficit.
The additional funding being proposed here for Social Security averages less than 1.0% of GDP over the next 20 years – not an inconsequential sum, but still a relatively small price to pay for securing the Social Security system for the indefinite future. And the expense involved is manageable even if the surpluses turn out to be considerably less than currently projected.
The second part of step 1 provides an alternative method of closing the long-term funding shortfall. As noted above, the long-term problem facing Social Security is longer lifespans. If we are to spend a longer portion of our lives in retirement, then we will either have to accept lower benefits during our retirement years or pay a higher tax rate during our working years. Most retirees already have only modest incomes, and so this proposal, rather than reduce incomes further with benefit cuts, would index the tax rate to the projected increases in the length of retirement. The tax increases needed to finance the projected lengthening of retirements would be relatively modest on an annual basis, just 0.02% per year for each employee and employer, a relatively small part of the 1.1% annual increase in real wage growth projected by the trustees. For example, by 2020 the tax increase would take approximately $140 a year from a worker earning the average annual wage of $31,800; an equal increase would be incurred on the employer side.4 These tax increases will become more substantial over the long run. For example, after 50 year
s, the tax rate on both the employee and employer will have increased by nearly a full percentage point. However, by that time average real wages are projected to be nearly 75% higher than at present, and so workers will still have far higher after-tax wages than they enjoy today.
It is possible to solve the long-term shortfall through some combination of the two proposals in step 1. For example, the amount of general revenue placed in the trust fund can be cut in half if it is combined with an increase in the payroll tax of 0.01 percentage point a year on the employer and employee.
The policy change proposed in step 2 is merely a way of ensuring that we keep the projections consistent through time. The changes in the calculation of the consumer price index are important for Social Security because benefits for retirees are indexed to it. In the spring of 1998, the Bureau of Labor Statistics announced changes to the CPI that will reduce the measured rate of inflation by 0.2 percentage points annually. This change means that, if the old CPI would have measured a 2.5% rate of inflation, the new CPI would measure a 2.3% rate. As a result of this reduction, the Social Security system will pay out less money over time in benefits, but this change has not yet been included in the projections. When the change is incorporated – presumably in the 1999 trustees’ report, the long-term shortfall will fall by 0.28% of payroll.
Other changes made over the last four years in the way the CPI is calculated have yet to be included in the projections. The impact of these changes on the CPI is hard to determine precisely, although some experts believe that it has been large. For example, the president’s Council of Economic Advisors estimated that the impact of the changes made in calculating the CPI since 1994 has been to lower the measured rate of inflation by 0.69 percentage points annually (Economic Report of the President 1998, 80); to date, only 0.2 percentage points of these changes have been incorporated into the trustees’ projections. If the trustees were to fully incorporate the CEA assessment, the projected shortfall would fall by approximately 0.7% of payroll, or nearly one-third. Note that this proposal incorporates only the 0.28 percentage-point reduction in the shortfall that can be projected based on the inclusion of the BLS’s most recent changes in the CPI.
Step 3 – raising the cap on wages subject to the payroll tax – would counteract the drain on the trust fund that has resulted from the upward distribution of wages in recent years. In the early 1980s, 90% of wages fell under the cutoff point for Social Security taxes, which is currently about $68,000. However, wage income has increasingly shifted upward to those at the top end of the wage distribution. As a result, the portion of wages that are earned by people who make less than the cap has declined to 87% today and is expected to drop further to 85%. If the cap were raised to keep the share of wage income subject to Social Security taxes constant at 90%, the long-term shortfall would be reduced by 0.55% of payroll. If implemented today, this change would raise the cap to approximately $97,000. So that affected workers could see some return on these taxes, the cap on benefit payments would be lifted to correspond to this higher tax rate.
Taken together, these three changes (using either part of step 1) will be sufficient to keep the trust fund solvent through the 75-year planning horizon.5 Although there are clearly some costs associated with the increase in the cap, most of the burden will be borne by those who have fared best in recent years.
Three misconceptions
A number of proposals have been offered and are continuing to be offered for addressing the long-term funding problem in Social Security. Many prominent proposals, several of which will be examined in the next section, and much of the public discussion unfortunately rest on misconceptions about the returns that can be expected in the future in the stock market, the potential for raising the retirement age, and the accuracy of the consumer price index.
Misunderstandings about future returns on stock
A key feature of many recent proposals to shore up Social Security is privatization – investing all or a portion of the trust fund in stocks and bonds or allowing individuals to direct their own investments of Social Security savings. When making projections for the returns from a privatized system, most authors assume, as did the president’s Advisory Council on Social Security, that the returns in the stock market will be the same in the future as they were in the past.
Projecting the future based on the past usually makes sense, but in the case of stock market returns in the next century there are two problems. First, the trustees, while projecting stocks to continue along their historic path until 2075, expect that the overall economy and profits will grow only half as fast over the next 75 years as in the previous 75. If one assumes that price-to-earnings ratios will be held roughly constant, then a cut in the growth of real corporate profits, from the 3.0% a year experienced over the last 75 years to the 1.5% projected for the next 75 years, suggests that projections for stock market returns should be reduced by 1.5 percentage points as well.6
The second reason that future returns will likely be lower than in the past is that stock prices are currently at record highs in relation to corporate profits. This means that annual dividend payouts (the ratio of the annual dividend to the price of a share of stock), which historically run at about 4.0%, are at record lows of about 2.0%. Unless stock prices plummet, they will fall more in the future. Assuming that price-to-earnings and dividend payout ratios remain near their current levels, then future dividend returns will be 2.0 percentage points less on average than in the past.
Combining these two effects means that projections for the average return on stocks over the next 75 years should be reduced by approximately 3.5 percentage points, from the 7.0% of the last 75 years to 3.5%. The difference for a long-term investor is enormous. For example, after 40 years, $1,000 invested at 7.0% will have grown to nearly $15,000; by contrast, at 3.5%, $1,000 will grow to only $3,960. It is unfortunate that many of those pushing for privatization have based their projections for stock returns on a naive extrapolation from the past.
Misconceptions about raising the retirement age
Many of the proposals for Social Security point to the fact that people are living much longer, healthier lives than their parents and grandparents and call for rapid increases in the normal retirement age (the age at which a worker is eligible to receive full benefits, currently 65). Several proposals would raise the normal retirement age to 68 by 2017 and to 70 by 2029.
This suggestion misunderstands both the nature of work and the current shape of the labor market. Professionals who do not have physically demanding jobs and who find their careers rewarding may look forward to continuing their work until late in their life. But their experience is atypical. Much of the workforce, including the 15% employed in manufacturing, the 5% employed in construction and mining, and the tens of millions employed in restaurants, hospitals, schools, offices, and stores, are engaged in physically demanding labor. To force these people to race around in their late sixties waiting on tables, changing bed pans, or cleaning offices would introduce a brutal class bias to Social Security. Unfortunately, the people who develop and decide upon Social Security plans are mostly among the small minority of the workforce
that could reasonably be expected to work until 70.
The other major misunderstanding underlying proposals to raise the retirement age is the failure to recognize that the decision to retire is often not voluntary. Increasingly, firms are forcing out workers in their late fifties or early sixties as a way to save money. These workers are often at the top of their pay scales, and firms realize that they can reduce their payroll costs by replacing more senior workers with lower-paid new hires. In fact, older workers have been a prime target of the most recent wave of downsizing (Aaronson and Sullivan 1998). When these older workers lose their jobs they are often hard pressed to find comparable employment, and while they may be able to find a low-paying job that will allow them to make ends meet, a Social Security reform plan that requires people to work at McDonald’s for five years before retiring is not an attractive outcome. In this scenario, even workers in less physically demanding white-collar jobs may find it difficult to retire later.
In the longer term, it is possible that people reaching age 65 in the year 2050 or 2060 will be more likely to opt to work later in their lives and forego the benefits of a longer life expectancy entirely in the form of a longer retirement. But in any case, we are not really making retirement policy for them; future generations will have many opportunities to adjust Social Security retirement policy to their own needs. We are, however, setting a fairly firm policy for people retiring in the next 15 or 20 years. Based on our current knowledge of the workplace and the labor market for older workers, raising the retirement age now would create an unfair burden on people who have spent a lifetime working for a living.
Misunderstandings about the CPI
Many reform plans take for granted that the CPI substantially overstates the true increase in the cost of living even taking into account the recent changes that government statisticians have put in place. Based on this assumption, they call for cutting the annual cost-of-living adjustment (COLA) in Social Security benefits, often by a full percentage point or more. This approach has a major problem: there is no compelling evidence that the CPI significantly overstates the increase in the cost of living.
The evidence mustered by the Boskin Commission and others to argue that the CPI overstates inflation is largely speculative; much of it is based on introspection and guesswork rather than careful research (Baker 1997; Moulton and Moses 1997). Furthermore, while there has been a considerable effort to find ways in which the CPI overstates inflation, relatively little time has been spent examining possible sources of understatement. For example, in the health care industry much has been written about the deterioration in service quality associated with the switch from traditional health insurance to health maintenance organizations, but no one has examined these situations in which the quality of goods and services might have worsened in ways not detected by the CPI. Finally, some groups, such as the elderly, may experience a higher rate of inflation than the rest of the population. The Bureau of Labor Statistics constructed an experimental index which indicated that the increase in the cost of living for the elderly was on average 0.3-0.4 percentage points higher each year than for the population as a whole.
But even if the CPI significantly overstates inflation, it is not necessarily the best policy to reduce annual COLAs. Because the effects are cumulative, reducing the COLAs will hit people harder the longer they live. For example, if the COLA were reduced by one percentage point, a 75-year-old who has been collecting benefits for 10 years will receive approximately 10% less than if the COLAs had not been changed; an 85-year-old who has been receiving benefits for 20 years will get 20% less as a result of the cut in the COLA. The benefit reduction will reach 30% for those living into their nineties. Since the oldest elderly are also the poorest elderly, the proposal to cut the COLA will have the biggest impact on the poorest of the elderly – people who are struggling to get by and who are trying to avoid being a burden on their families. Hitting these people with large benefit cuts seems to be a perverse social policy regardless of the accuracy of the CPI.
There is another, equally important, reason why an overstated CPI does not necessarily mean that COLAs should be cut. If the CPI has been substantially overstating inflation, then real wages and incomes have been rising far more rapidly than previously thought. For example, if the true rate of inflation is one percentage point less than indicated by the CPI, then real wages and incomes have been growing one percentage point more than current data indicate. This means that we are much richer relative to our parents than we have recognized, and that our children will be far wealthier than we have projected. In fact, when the Social Security trustees’ projections are adjusted for an overstatement of this magnitude, they imply that real wages will be approximately twice as high in 2030 as they are today. If this is true, and our children really will be quite wealthy, there is no reason to be cutting the Social Security benefits of our parents, particularly since they’re probably subsisting on very modest incomes as it is.
It is worth noting that this improvement in projected living standards dwarfs anything that we might have hoped to accomplish through higher savings. For example, CBO estimated that an increase in national savings of approximately 2 percentage points of GDP (or about $170 billion, a large increase) would increase the rate of income growth by just 0.05 percentage points a year (CBO 1996, 90). In other words, if the true rate of inflation is 1 percentage point less than the rate measured by the CPI, then the upward adjustment in the rate of real income growth would be 20 times as large as what would be obtained from a $170 billion increase in annual savings. In short, if the CPI significantly overstates inflation, then the future is so much brighter than we had previously believed, making the impact of any changes in national savings seem trivial.
Other plans for saving Social Security
Three plans have recently been put forward to restructure the Social Security system that are broadly representative of the types of plans now prominent in the public discussion. These are:
- a proposal for limited individual savings accounts, put forward by the National Commission on Retirement Policy;
- a plan for greater privatization, supported by five members of President Clinton’s Advisory Council on Social Security last year; and
- a plan for a series of tax and benefit cuts, recently announced by Senators Daniel Moynihan and Bob Kerrey.
At present, there are many proposals for addressing the long-term shortfall in the Social Security system, but while the plan described earlier preserved the current schedule of benefits throughout the 75-year planning horizon, nearly all other proposals do not. Most of these plans involve increasing the retirement age, cutting future benefits, and mandating that individuals invest some portion of their money in a government-regulated account. In some cases these plans will involve considerable pain not only for workers in the future but also for current generations of workers. For example, privatization proposals must be financed by a transition tax, either transparent or hidden, since benefits must still be paid out to current retirees while a portion of current taxes are being placed in private accounts. These taxes are often quite large; for example, the partial privatization that was endorsed last year by five members of the president’s Ad
visory Council on Social Security called for an immediate increase in the payroll tax of 1.52 percentage points, to be collected during a transitional period of 75 years.
In addition to substantially reduced benefits and/or increased taxes, most of these plans will provide future retirees a much less secure base retirement income than does the existing Social Security system. In many cases, moderate-income workers will see cuts in their projected level of benefits of 20% or more.
The National Commission on Retirement Policy proposal
This plan proposes to eliminate the long-term shortfall in the Social Security fund through large benefit cuts targeted at moderate-income workers. It includes a rapid increase in the normal retirement age to 68 by 2017 and to 70 by the year 2029. The proposal also raises the age for early eligibility, the option selected by most workers, from 62 at present to 65 by 2017. This change can be seen as both a benefit cut and an implicit tax increase, since it will force many people to work longer and therefore pay Social Security taxes for a longer period than would be the case under current law. The plan also suggests that annual cost-of-living increases be 0.5 percentage points less than the rate of inflation that would be measured by the current CPI. (Since the BLS recently implemented changes that will lower the annual rate of inflation measured by the CPI by 0.2 percentage points beginning next year, this plan would call for a further reduction of 0.3 percentage points in the annual cost-of-living adjustment.)
National Commission on Retirement Policy plan
|
The plan would also require workers under age 55 to place 2.0 percentage points of their payroll tax into individual savings accounts modeled after the Thrift Savings Plan for federal employees. Such a centralized system should keep administrative costs relatively low;7 the estimated cost of these accounts is 0.105% annually of the total money held, based on the current cost of the Thrift Savings Plan. The funds in these accounts could not be withdrawn prior to retirement except in the case of permanent disability or death. At retirement, the money accumulated in the accounts would be converted into an annuity, which the plan assumes will be done at no cost since the conversion will be mandatory and done by the government agency administering the accounts.
The plan does include a provision that may increase benefits somewhat for the poorest beneficiaries in that it provides a poverty-level benefit to anyone who has worked for 40 years. This benefit is phased down, so that a person who has worked 20 years will get a benefit equal to half of the poverty level. However, under current law there are few people who have worked 40 years who would not be eligible for a poverty-level benefit or who have worked 20 years who would not receive a benefit equal to half the poverty level; in fact, more workers will be put into this situation as a result of the cuts in the commis-sion’s proposal. The main impact of this provision will likely be to replace Supplemental Security Income benefits that are financed through general revenue with a minimal Social Security benefit that is financed through the less-progressive payroll tax. Also, any gains for lower-income workers that result from this provision will be at least partially offset by an increase in the number of working years used to calculate benefit levels. Benefit levels are currently based on a worker’s highest 35 years of earnings. Under this plan, the number of years used to calculate the benefit base would increase to 40 by 2006. For many workers, particularly women who have spent several years out of the labor force raising children, this change in the formula will add five years of zero earnings. In this situation, benefits would be reduced by 12.5%.
The people who will be hit hardest under this plan are middle-income workers in their thirties and forties at the time of the transition who find themselves unable to work as late in life as the plan’s authors envision. These people will feel the brunt of both the proposed benefit cutbacks and the increase in the retirement age. They also are unlikely to experience large enough gains in their private savings account to significantly offset their loss in guaranteed benefits. Under current law, an average income worker ($27,026 annual wage in 1998) who retired at age 65 in the year 2015 would receive $12,733 in today’s dollars in annual Social Security benefits. (See the appendix for an explanation of the projections used in this section.) Their benefit under the commission’s proposal would be just $10,306, a reduction of 19.1%. The benefit reduction would be even larger for a 30-year-old worker in 1995 who plans to retire at age 65 in the year 2030. Under current law, an average-income worker retiring at age 65 in 2030 would get $13,854 in today’s dollars. Under the commission’s proposal, this worker would receive just $8,636, a reduction of almost 38%.
The money placed in the mandated savings accounts will not go far toward offsetting these cuts. As explained in the appendix, these calculations assume that stock prices track the projected growth of profits and that the dividend payout ratio stays constant. (The same assumption is also made in assessing the Scheiber-Weaver plan.) By 2015, average-income wage earners will have accumulated just $11,126 in their accounts, sufficient to provide an annuity of approximately $820 per year and still leaving their benefits at just $11,126, a reduction of 14.5% from the levels of the current Social Security system. By 2030, these same workers will have accumulated $32,280, providing an annuity of approximately $2,150 annually and raising the annual benefit payment to just $10,786, a reduction of more than 22% compared to the current system.
Table 1 compares the level of benefits that the Social Security trustees currently project for low-, average-, and high-wage earners retiring at age 65 and the estimated benefits that these workers would receive under the commission’s plan. As the table shows, the commission’s proposal involves large cuts for all categories of workers, but the cuts are proportionately larger for moderate and above-average wage earners than for those at the bottom. These cuts will begin to impact workers almost immediately, so that workers who are currently near retirement will have little opportunity to offset these cuts through additional savings. For example, all categories of workers would have to increase savings by more than 3.0 percentage points of their current wage income to offset the loss of benefits in 2015. Increases of this magnitude would require a doubling of the current savings rate and a corresponding cut in current living standards. This plan will almost certainly lead to a significant decline in the standard of living for future retirees.

lass=”small”> DOWNOAD EXCEL SPREADSHEET OF TABLE 1
It is also important to note that the cuts measured against the current schedule of benefits will get even larger through an individual’s retirement due to the reduced COLA provided under this plan. Each year, retirees will receive 0.3 percentage points less than they would have without the change proposed by the commission. Thus after 10 years of retirement, the annual Social Security benefit will be cut 3.0%. The benefit reduction will have reached 6.0% of annual benefits after 20 years, 9.0% after 30 years.
With all these substantial cuts, the commission’s plan goes well beyond the amount that is needed to balance the fund. According to the Social Security Administration, these cuts would reduce the long-term deficit by 2.49% of payroll, 0.3 percentage points more than is necessary to balance the fund over the 75-year planning horizon. It appears, then, that the commission is proposing to use more than $1.2 trillion in Social Security taxes over the next 75 years to pay for other categories of government spending. The current Social Security program is very important in workers’ lives, and its benefit structure is quite progressive. For these reasons, there is a reasonable case for financing it with a payroll tax that is regressive. However, it is difficult to justify using a regressive Social Security tax to finance other categories of government spending, as the commission proposes.
The Scheiber-Weaver plan
The president’s Advisory Council on Social Security issued its report on the future of the program in January 1997. One of the proposals in the report, supported by five of the 13 members of the council, called for partial privatization of the Social Security system. This proposal, generally known as the Scheiber-Weaver plan after the two members of the council who designed it, calls for placing 5.0 percentage points of the current payroll tax into personal savings accounts. The remaining portion of the payroll tax would finance the disability program and a core retirement benefit that all workers would receive. This core benefit was set at $410 per month in 1998 and is wage-indexed for future years. Because this plan is similar to many of the more extreme privatization proposals that have been put forward in the last few years, it can be taken as a model for plans that call for more large-scale privatization than does the national commission’s proposal.
Under the Scheiber-Weaver plan there would be a 40-year transition period in which workers would be phased into the new system. Workers over 55 would remain completely under the current system, while workers under 25 would be exclusively covered by the new one. The benefit levels provided through the transition are comparable to current levels, once the accumulations in the savings accounts are added in. The biggest near-term benefit change under this proposal is the requirement that 50% of all benefit payments be immediately subject to the income tax. This change would mean a benefit cut of more than $1,000 a year for many moderate-income retirees who currently pay no tax on their benefits if their income is under $25,000. Some higher-income beneficiaries would benefit from this change, since they now pay tax on up to 85% of their benefits. This plan would also raise the normal retirement age to 67 by 2012 and index the retirement age to life expectancy in subsequent years, meaning an increase in the normal retirement age of approximately one month every two years.
Scheiber-Weaver plan
|
The biggest near-term problem with this proposal is the cost of the transition. Since benefits for current retirees and those over 55 are not reduced under this plan, and benefits for future retirees are only gradually scaled down, the government will still have to pay out as much in Social Security benefits as under the current system while collecting far less in Social Security taxes each year. This lost tax revenue will have to be made up from other sources. The Scheiber-Weaver plan has two ways to make up this revenue. First, the payroll tax will be increased immediately by 1.52 percentage points, covering less than half of the transition costs. Second, the government will have to borrow. The Social Security Administration estimated that the transition costs associated with this plan would add more than $1 trillion to the national debt. It is interesting to note that these two revenue-raising plans by themselves – raising the payroll tax and borrowing $1 trillion – would be sufficient to make up the 75-year shortfall in the Social Security fund.
The Scheiber-Weaver plan was put forward at a time when the budget was in deficit and when deficits were projected for the foreseeable future. However, nothing about the basic arithmetic of the transition costs changes now that the government has a surplus. The government can use the surplus to finance a transition to a privatized program, but that would mean that these same funds could not be used to support other worthwhile programs or to provide tax relief. The cost of the transition is not changed by the existence of a surplus, although the surplus may make the cost politically easier to hide. Instead of having to borrow or raise taxes to pay for the transition, Congress will have to forego funding other programs or providing tax relief that it would have otherwise.
The Scheiber-Weaver plan would substantially reduce the base income provided through Social Security for most workers, even when one includes the money earned through the personal savings accounts. It will also make the benefit far more insecure, since a significant portion of it will be subject to the random fluctuations in financial markets and the luck and skill with which workers choose investment instruments. The plan will also create an enormous bounty for the financial industry, since individuals will be forced to pay large fees on this portion of their retirement income.
For most workers, the core benefit will provide the bulk of the income they get from this system. Table 2 shows the distribution of projected benefits for a low, average, and high income worker retiring at age 65 in 2045, when the privatized system will have been fully phased in. It also shows the benefits that these workers would receive under the existing system. In addition, it includes the accumulated total that each category of worker will have paid out in administrative fees to the finance industry over his or her working life.

DOWNOAD EXCEL SPREADSHEET OF TABLE 2
As can be seen, most workers will do substantially better under the existing Social Security system than under the privatized system, mostly because they avoid the large administrative fees associated with a privatized system. For these calculations, the low-cost scenario assumes the 1.0 percentage point annual administrative fee that the Social Security Administration used when it analyzed this proposal; the high-cost scenario assumes a 2.0 percentage-point fee, which may be more accurate given the costs associated with the handling of small accounts. (This is within the range of costs estimated for administering Britain’s privatized system; see Diamond 1997, 49. The low-cost scenario assumes that insurers will change a 15% fee to convert an accumulated sum into an annuity, while the high-cost scenario assumes a 20% fee, the high and low end of the range currently charged by insurance companies, found in a recent study by Mitchell, Poterba, and Warshawsky 1998.)
The numbers shown in Table 2 probably overstate the benefits that most workers will actually receive under the Scheiber-Weaver plan, since the calculations assume that people earn the same wage (relative to the overall wage scale) through their whole careers. In reality, most workers will earn much less early in their life and far more in their later years. This does not affect the Social Security benefits workers receive, since the formula averages wages over a working lifetime without regard to actual patterns of earnings. However, in projecting the accumulations in a privatized system, the ordering will be important. Most workers have low earnings when they are young, so they will put very little aside in their early years and will thus benefit little from having the interest on these savings compound for a long period of time. On the other hand, money saved in the last years before retirement, presumably high-earning years, will garner little interest, because it will not have been saved for a long period. For this reason, the benefits shown in the table for the Scheiber-Weaver plan are probably much higher than workers will actually receive.
The table also does not take account of the variability of benefits under this plan. The numbers show only average returns that can be expected given current stock prices and the projected growth in profits; individual workers may opt for an investment plan that does much better or worse than average, leading to large differences in retirement benefits across workers within an age cohort. There can also be large differences in benefits between age cohorts if, say, the stock market dropped sharply from one year to the next.
The cumulative fees shown in Table 2are also striking. As noted earlier, the low-cost scenario follows the Social Security Administration in projecting that the expenses on these accounts will be just 1.0% a year. It also assumes that the cost of purchasing an annuity will be just 15% of accumulated assets, the low end of the range found in a recent study (Mitchell, Poterba, and Warshawsky 1998). Even in this case, an average-wage worker will pay more than $40,000 to the financial industry for the benefits associated with this plan. In the less-optimistic case, an average-wage worker will pay close to $70,000 to the financial industry – enough money in many parts of the country to buy a house.
The Moynihan-Kerrey plan
The proposal recently put forward by Senators Daniel Moynihan and Bob Kerrey shares many of the features of the national commission’s plan. It calls for an increase in the normal retirement age to 68 by 2017, and it increases the number of working years used to compute benefits from 35 to 38. The Moynihan-Kerrey plan also calls for a reduction of 2 percentage points in the payroll tax, although, unlike the commission’s plan, it is up to the individual whether or not to save this money. The major difference between the plans is that the Moynihan-Kerrey plan does not include the large cuts in the benefit formula contained in the commission’s plan. Instead, under the Moynihan-Kerrey plan, the value of retirees’ benefits is eroded through time as a result of a lower COLA. For older retirees, the Moynihan-Kerrey plan will actually lead to larger cuts in benefits than will the commission’s plan.
The Moynihan-Kerrey plan
|
The Moynihan-Kerrey plan defends a 1.0 percentage-point reduction in the COLA by claiming that the CPI overstates the true increase in the cost of living by the same amount. But as noted in the last section, the evidence for a significantly overstated CPI is quite limited. In any case, a lower COLA means that beneficiaries will see a decline of 1.0% in their benefits compared to current law. This change will hit older people, typically the poorest of the elderly, the hardest.
Table 3A shows the benefits for a low-, average-, and high-wage worker who retirees at age 65 under the current system and under the Moynihan-Kerrey plan. It also shows the benefits workers will receive if they choose to save their tax cut and annuitize the benefits. The cuts at age 65 are entirely attributable to raising the retirement age .8 At age 75 the cuts are considerably sharper, since the lower COLAs will have eroded the annual benefit by an additional 9.6%. The annual benefit will have been reduced by 19.2% at age 85 and by 26.0% at age 95. Because the lower COLAs in the Moynihan-Kerrey plan would take effect immediately, people who are already retired would experience a similar reduction in their benefits.

DOWNOAD EXCEL SPREADSHEET OF TABLE 3A
The inclusion of an annuity from the individual savings accounts will go only a short way toward offsetting these loses. The evidence on voluntary systems of this type suggests that most workers will not save their tax rebates, and the poorest workers are the least likely to save. Moreover, since the Moynihan-Kerrey plan does not provide for a central system and mandatory annuitization, as does the national commission’s plan, much of the savings under this system are likely to be wasted on administrative expenses.
If the Moynihan-Kerrey plan is correct in its assessment of the CPI, then the future will be quite different than current projections suggest, since real wages and income must be growing 1.0 percentage point more each year than was thought. Table 3B shows projections for real income and benefit levels under the assumption that Senators Moynihan and Kerrey are correct in their assessment of the CPI. All the numbers are in 1998 dollars.

DOWNOAD EXCEL SPREADSHEET OF TABLE 3B
As the table shows, average wages will have nearly doubled by 2030 and will be more than 2.5 times higher by 2045. In fact, the l
ow-wage worker in 2045 is projected to earn more than the average-wage worker does today. Annual benefits will also be proportionately higher for future retirees in real terms. In this view of the world, since our children and grandchildren will be far wealthier than we are today, there seems to be little justification for taking away benefits from the current elderly in an effort to aid future generations who are presumably going to be very well off.
Finally, it is worth noting that the Moynihan-Kerrey plan, like the proposal from the national commission, would cut benefits by more than is necessary to balance the fund. Thus, this plan would also use designated Social Security taxes to finance other categories of government spending.
Conclusion
Social Security has been a remarkable success story. It has provided tens of millions of workers with the base income they needed to have a decent retirement, and it meets its objectives more efficiently than do private alternatives. At present, the Social Security fund is sound: the projections from the trustees show that it can continue to pay all promised benefits for at least another 34 years with absolutely no changes in benefits or taxes. Even beyond this point, the projections indicate that the fund will still be able to pay 73% of scheduled benefits.
Over the very long term, changes will be necessary for the fund to pay all promised benefits. This paper has proposed a set of modest changes that will allow all benefits to be paid over the 75-year planning horizon. Under this proposal the costs of bringing the fund into long-term balance will be borne by those who can most afford it: the higher-income workers who have benefited most from recent economic trends.
By contrast, other prominent proposals for restructuring Social Security will inflict considerable pain on those ill-positioned to make further sacrifices. In the case of the proposal put forward by the National Commission on Retirement Policy, the biggest losses would be incurred by moderate-income workers who will be retiring in the next two decades. These are workers who have seen stagnant or declining wages for much of their working careers and now face the threat of downsizing as they prepare for retirement. The Scheiber-Weaver plan poses less of a threat to older workers, but in the longer run it will substantially reduce the benefit levels and security provided through the Social Security program. When it is fully phased in, average benefits (including earnings on private savings accounts) will be more than 25% less than under the current system, and there will be considerable variation in benefits among individuals and age cohorts. This plan also will hit current workers with an immediate tax increase equal to 1.52 percentage points of payroll. The Moynihan-Kerrey plan would also impose substantial costs on those retiring in the next two decades, but, in addition, it would significantly reduce benefits for those already retired. Under this plan, people already retired will see their benefits lowered 1.0% a year compared with what they would receive under the current program. Those who live into their eighties and nineties, the poorest of the elderly, will see benefit reductions of between 20% and 30%.
It is important that, with all the attention being focused on Social Security, we do not lose sight of the basic facts. The program is completely solvent until far into the future, and needs only modest changes to make it fully solvent over the 75-year planning horizon. The public overwhelmingly approves of the existing Social Security program and wants its basic structure to be kept intact for future generations. The crippling of the program through misinformation and scare tactics would be a national tragedy.
Appendix
The schedule of projected contributions from the federal budget surplus to the trust fund is as follows:
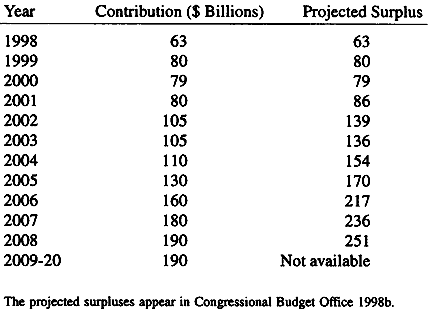
The baseline projections of benefits that appear in Tables 1, 2, 3A, and 3B are derived from the projections in the 1998 Social Security trustees report, page 183. An additional 0.2 percentage points of annual real benefit growth was added to these projections, since the 1998 trustees report did not incorporate the impact of the recently announced changes in the CPI. The base projections for future wage growth appear in the 1998 trustees report, page 57. These also were adjusted upward by 0.2 percentage points to reflect the recent change in the CPI.
The projected benefit levels for the national commission’s proposal assume that the indexation formulas are adjusted downward in accordance with the commission’s proposal (the second and third indexation factors are multiplied by 0.98 each year from 2000 through 2029), and the benefit reduction for early retirement follows the path specified in the Social Security Administration’s analysis of the proposal (SSA 1998, 4-5). By 2015 the normal retirement age for the cohort turning 65 in that year will be 67 years and 6 months, leading to a benefit reduction of approximately 16% for those retiring at age 65 (SSA 1998, 69).
The projected returns on the individual savings account assume that money placed in these accounts is split evenly between stocks and bonds. The projected stock returns assume that price-to-earnings ratios remain at their current record high levels, meaning that stock prices will follow the growth in profits. The returns assume that profits follow the path described by the Congressional Budget Office through the end of its projection period in 2008 (CBO 1998a, xvii). Real profits actually decline slightly over the next 10 years in this projection. In subsequent years, profits are assumed to grow at the same rate as GDP, as is projected in the trustees report. The dividend payout is assumed to remain at its current level of approximately 2.0% throughout this period. The total return on stocks is then the sum of the real growth rate of profits (the rise in the price) and the 2.0% annual dividend payout, which averages slightly less than 3.5% annually over the 75-year planning horizon. The return on the portion of the accounts invested in bonds is assumed to be the same as the rate of interest projected in the trustees report.
Like the calculations of the Social Security Administration, these calculations assume that administrative expenses on these accounts are 0.105% annually. This may be an unrealistically low figure, since many of these accounts will be very small. For example, a worker earning $8,000 per year will have accumulated less than $1,000 in an account after five years. Administering this account at a 0.105% fee means that the cost will be less $1.00 annually. It is assumed that the accumulation is converted into an annuity at age 65, at zero cost to the individual, and that the annuity pays a real interest rate of 2.7%, the same assumption used in the Social Security Administration’s analysis of the proposal.
The calculated accumulations in the Scheiber-Weaver plan assume that the funds are split evenly between stocks and bonds. The returns for each were calculated using the same procedure described for estimating accumulations in the national commission’s proposal. The low-cost scenario assumes that administrative fees will average 1.0 percentage point annually, as was assumed by the Social Security Administration in analyzing the proposal (Advisory Council on Social Security 1997). In converting the accumulated sums into an annuity, it is assumed that workers will pay a fee of 15%, the end of the range estimated in a recent study (Mitchell, Poterba, and Warshawsky 1998). The high-cost scenario assumes that the annual administrative costs will be 2.0%, which was recently estimated to be the costs of the private accounts in Britain (Diamond 1997). It is assumed that the premium paid to turn th
e accumulated funds into an annuit
Endnotes
1. The projections from the Congressional Budget Office (CBO) show even larger surpluses over the 10-year horizon (CBO 1998a). The CBO projections show the annual surpluses rising to $197 billion in 2008, the latest year for which it makes projections. CBO projects the cumulative surplus over the 10 years from 1998 to 2007 to be $1,450 billion. The Social Security trustees project that the surplus accumulated over this period will be more than $140 billion less, at $1,308.5 billion. Using the CBO projections for the period through 2008 instead of the trustees projections would add two years of solvency to the fund, pushing the date of depletion out to 2034.
2. By 2030 the normal retirement age will be 67, instead of the current 65. The numbers given here are approximations, since they do not fully capture the effect of the increased probabilities that people will live to the age where they can begin receiving Social Security benefits.
3. By 2032, the year in which the trust fund is now projected to be depleted, the youngest baby boomers will be 68, the oldest 86. The 1999 projections will incorporate the impact of a recent technical change in the consumer price index. This change (discussed further in the next section) should push the projected date of the fund’s depletion to approximately 2036. At this point, the youngest baby boomers will be 72, the oldest 90.
4. The impact of this increase for moderate income workers could be offset through an expansion of the earned income tax credit. The cost would be modest, primarily because the impact of the tax increase would be small. For example, by 2020 the tax increase would cost a person earning $12,000 a year slightly less than $53 a year.
5. There are two other changes which are frequently mentioned that could also reduce some of the long-term shortfall without jeopardizing the basic features of the program. First, a portion of the income tax paid on Social Security benefits is currently attributed to the Hospital Insurance Trust Fund. Attributing this money to the Social Security fund would reduce the long-term shortfall by 0.21% of payroll. Second, Social Security could be made a fully universal system by bringing all state and local employees into the program. If all state and local government employees were required to be in the system, the rule should apply only to new hires at some point in the future (e.g., 2010), in order to allow an adequate period for the existing pension systems for these workers to adjust to the change. This step would reduce the long-term shortfall by approximately 0.2% of payroll.
6. Stock prices can rise more rapidly than profits — indeed, they have over the last 15 years – but this trend leads to a rise in price-to-earnings ratios. Rising price-to-earnings ratios mean that investors are paying more and more for stock that has less and less intrinsic value. In order to give the returns assumed by proponents of privatization, price-to-earnings ratios, already at record highs, would have to rise from their current levels of approximately 28 to 1 to over 400 to 1 by the end of the 75-year planning horizon.
7. Many people have expressed concern about political factors affecting investment decisions if the Social Security fund were directly invested in the stock market, as advocated by former Social Security Commissioner Robert Ball. This concern is equally relevant to the centralized system of accounts proposed under this plan. Since money would be invested centrally under this plan, it would as easy to apply political criteria to investment decisions as it would be if the Social Security fund were invested directly. Even in a system of decentralized accounts, political criteria for investment could be imposed as a condition of acceptance as a qualified account. In any system in which Social Security funds or mandated savings accounts are invested in private equities, it will always be possible for political factors to affect investment decisions. Whether or not this happens will depend on the judgment of elected officials in the future, not the system put in place at present.
8. The Moynihan-Kerrey plan also calls for raising the number of years included in the indexation formula to 38. This cut primarily hits women who left the labor force for a number of years to raise children. The effect of this cut is not indicated in the chart, nor is the impact of taxing the benefits of moderate-income retirees.
References Aaronson, D., and D.G. Sullivan. 1998. “The Decline of Job Security in the 1990s: Displacement, Anxiety, and Their Effect on Wage Growth.” Economic Perspectives, First Quarter, Federal Reserve Bank of Chicago, pp. 17-43.
Advisory Council on Social Security. 1997. Report of the 1994-1995 Advisory Council on Social Security. Washington, D.C.: U.S. Government Printing Office
Baker, D. 1997. Getting Prices Right: The Debate Over the Consumer Price Index. Economic Policy Institute series. Armonk, N.Y.: M.E. Sharpe.
Congressional Budget Office. 1996. The Economic and Budget Outlook for Fiscal Years 1997-2006. Washington, D.C.: U.S. Government Printing Office.
Congressional Budget Office. 1998a. The Economic and Budget Outlook for Fiscal Years 1999-2008. Washington, D.C.: U.S. Government Printing Office.
Congressional Budget Office. 1998b. The Economic and Budget Outlook for Fiscal Years 1999-2008: A Preliminary Update. Washington, D.C.: U.S. Government Printing Office.
Diamond, P.A. 1997. “Macroeconomic Aspects of Social Security Reform.” Brookings Papers on Economic Activity, Brookings Institution, Volume 2, pp. 1-89.
Economic Report of the President. 1998. Washington, D.C.: U.S. Government Printing Office.
Mitchell, O.S., J.M. Poterba, and M.J. Warshawsky. 1998. “New Evidence on the Money’s Worth of Individual Annuities.” National Bureau of Economic Research, Working Paper No. 6002. Cambridge, Mass.: NBER.
Moulton, B.R., and K.E. Moses. 1997. “Addressing the Quality Change Issues in the Consumer Price Index.” Brookings Papers on Economic Activity, Brookings Institution, pp. 305-67.
Moynihan, Daniel Patrick. 1998. “Social Security Solvency Act of 1998.” U.S. Congress, Senate Finance Committee Minority Staff.
Social Security Administration. 1998. Annual Report of the Board of Trustees, Federal Old-Age and Survivors Insurance and Disability Insurance Trust Funds, 1998. Washington, D.C.: U.S. Department of Health and Human Services, Social Security Administration.
For a printer-friendly version of this report, click here.![]()