Briefing Paper #334
This paper examines the retirement security of current Oregon retirees and prospects for the retirement security of current workers. By examining the income sources of retirees, we highlight Oregon retirees’ heavy reliance on Social Security income and uncover important, and sometimes dramatic, differences in the reliance on Social Security and retirement funds1 by income, race, and gender. Major findings include the following:
- Social Security constitutes nearly half (47.6 percent) of all income for Oregon retirees.
- Social Security’s share of income ranges from 26.5 percent for retirees in the top quartile of earners to 85.0 percent for those in the bottom quartile.
- Retirement funds account for just 2.2 percent of annual income for retirees in the bottom quartile ($152 on average) but 41.0 percent of income for retirees in the top quartile ($21,511 on average).
- White retirees fare better than people of color, and men fare better than women.
- Retired Oregonians are less likely than Oregonians overall to live in poverty or extreme poverty, but retired Oregonians are also less likely than Oregonians overall to have incomes at or above 400 percent of the federal poverty level.
This paper also highlights where the disparities in income and income source originate by examining access to and participation in employer-sponsored retirement coverage. This access is modest overall and quite low among low earners and those working for smaller, private-sector firms:
- Nearly half of all workers age 25–64 are not covered by a retirement plan at work.
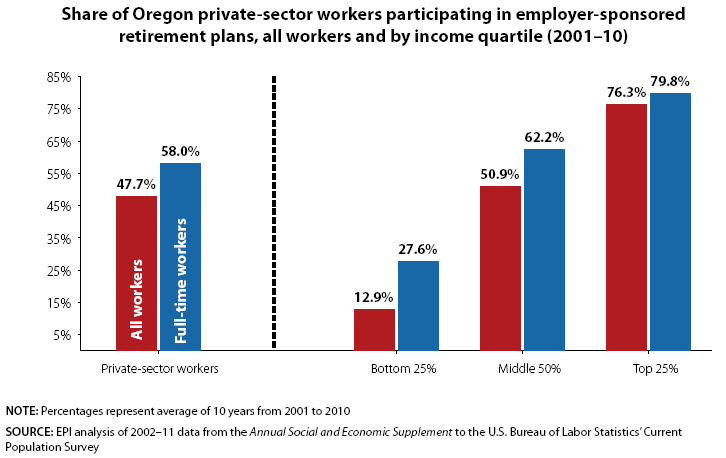
- Only one in eight private-sector workers in the bottom income quartile participates in an employer-sponsored retirement plan, compared with more than six in eight in the top income quartile.
- As firm size decreases, so does access to and coverage under employer-sponsored retirement plans: In very small firms (24 or fewer employees) less than one-fourth of employees participate in employer-sponsored plans, compared with nearly two-thirds in very large firms (1,000 or more employees).
Income among current retirees
This paper draws on 2002–11 data from the Annual Social and Economic Supplement to the U.S. Bureau of Labor Statistics’ Current Population Survey. To obtain reliable estimates for the state of Oregon, we combine 10 years of data to estimate income of current retirees and access to retirement plans among current workers. For the purposes of this analysis, retirees are defined as people age 60 and older who did not work during the reference period. For a full methodological discussion, see the appendix at the end of this paper.
Sources of retiree income

Oregonians on average benefit significantly from the public components of their retirement income, most notably Social Security (into which Oregon retirees have paid throughout their working lives), but also, to a much lesser extent, Supplemental Security Income.2

Social Security remains the most relied on source of income among current retirees in Oregon (see Table 1 and Figure A). Nearly half (48.4 percent) of retirees’ income comes from a combination of Social Security (47.6 percent) and Supplemental Security Income (0.8 percent). Retirement funds constitute just over a quarter (27.7 percent), and the remainder is a combination of dividend income (4.4 percent), rental income (4.1 percent), and other income (which includes income from personal savings, proceeds from the sale of stocks or bonds, and survivor’s benefits).
While the distribution of retirement income is noteworthy, so, too, is the amount of retirement income that sustains the “average” Oregon retiree.

While an analysis of all retirees in Oregon is instructive, digging a little deeper provides a more nuanced understanding of the well-being of Oregon’s retirees. There is a dramatic variation in both the amount and distribution of income sources across the income distribution. Table 2 breaks down sources of income by income quartile, examining separate income and income sources for the bottom 25 percent of retirees, the middle 50 percent, and the top 25 percent. The average income of the bottom 25 percent of retirees is $7,056 (ranging from $0-$10,653), less than half the $17,604 average income for the middle 50 percent of retirees (with incomes ranging from $10,654–$28,205). Retirees in the top quartile—with incomes starting at $28,206—have an average income of $52,508, nearly 7.5 times the average for the bottom 25 percent of retirees.

The pie graphs in Figure B highlight the drastic differences in sources of income for these three income groups. Importantly, none of the three distributions shown bears resemblance to the “average” distribution seen in Figure A. Instead, we see that the bottom three-fourths of retirees rely very heavily on Social Security income—the share relying on Social Security income is 85.0 percent for the bottom 25 percent of income earners, and 71.6 percent for the middle 50 percent of earners. Social Security contributes a still significant 26.5 percent of income for retirees in the top 25 percent.
Even more stark is the variation in the share of income derived from retirement funds across the income distribution. Those in the bottom 25 percent receive just 2.2 percent of their total income from retirement funds, while those in the top 25 percent receive 41.0 percent of their income from retirement funds—a share that is nearly 19 times greater than the corresponding share for the bottom 25 percent. Moreover, when comparing the amount of retirement funds by income category shown in Table 2, we see that those in the top quartile receive more than 140 times the income from retirement funds as those in the bottom quartile ($21,511 compared with $152). With annual retirement-fund income of just $152, it is clear that employer-based retirement plans contribute very little to the economic well-being of the bottom quartile of Oregon retirees.
Demographic differences in retiree income
Important demographic differences are also apparent in the data on Oregon retirees. As evident in Table 3, there are disproportionately more nonwhite people in lower income groups (and similarly higher shares of white retirees amongst the higher income quartiles). In the overall retiree population, 93.9 percent of retirees are white. In the highest income quartile, that share increases to 96.8 percent. Black retirees comprise a very small share of retirees in Oregon, and their share gets ever smaller as one moves up the income distribution, from 1.6 percent of retirees in the bottom quartile to 0.9 percent of the top quartile. Hispanic workers comprise a slightly larger share of the overall population of Oregon retirees, but like black retirees, their share shrinks as incomes increase, from 2.7 percent of retirees in the bottom quartile to just 0.6 percent of retirees in the top income quartile (even less than the share of the top quartile that are black).

Low-income seniors are also much more likely to be women. Women, who constitute 57.3 percent of all Oregon retirees, constitute more than four-fifths (82.8 percent) of retirees in the bottom quartile, but just a little over a third (34.7 percent) in the top quartile.
Poverty rates among retirees
In 2010, the poverty level for a single person was $11,139 and $14,218 for a two-person family. For a single person, 200 percent of the poverty level was $22,278, and it was $28,436 for a family of two. Table 4 and Figures C and D show the share of Oregonians and Oregon retirees at various income levels as measured in relation to the federal poverty level, including how the distribution varies by gender. These figures show that income inequality is less pronounced among retirees than among working-age adults.


These illustrations also suggest that Social Security is an effective anti-poverty program for retirees. The incidence of poverty (family income below 100 percent of the federal poverty level) and extreme poverty (family income below 50 percent of the federal poverty level) among retirees in Oregon is notably lower than for Oregonians overall. Between 2001 and 2010, 11.8 percent of all Oregonians were in families with income below the federal poverty level, compared with 7.5 percent of retirees. Importantly, the biggest difference is at the bottom, with only 1.4 percent of retirees experiencing extreme poverty, compared with 4.9 percent of the overall population.
While Social Security keeps many seniors out of poverty, benefits are fairly modest. As a result, 29 percent of Oregon retirees are just scraping by, with incomes between 100–199 percent of the federal poverty level. Furthermore, only 24.6 percent of retirees have incomes above 400 percent of the poverty line, compared with 35.4 percent of the overall population.
Moreover, this means of analyzing the economic security of seniors relative to the general population does not adequately account for the high medical needs of people age 60 and older. The U.S. Census Bureau’s newly constructed Research Supplemental Poverty Measure (SPM) highlights fundamental differences in the income needs of various age groups, taking into account particular types of expenditures, such as child care for families with children and higher average medical expenditures for the elderly. Using the SPM, many more seniors would fall below the minimum threshold needed to get by. Our previous comparisons, which did not take the SPM into account, may overestimate how well seniors are doing. Counting the cost of medical expenditures would increase the share of seniors who are considered poor relative to the working-age population.
Female retirees are more likely to be poor and near-poor than male retirees. As seen in Table 4 and Figure D, a larger share have incomes below the federal poverty level (8.8 percent compared with 5.7 percent) or have incomes below 200 percent of the federal poverty level (40.2 percent compared with 31.4 percent). The share with incomes between 200 percent and 299 percent of the federal poverty level is very similar, while a much smaller share of female retirees have incomes greater than 300 percent of the federal poverty level (36.2 percent compared with 44.3 percent).
Retirement-plan coverage among current workers
Nearly half of workers age 25–64 in Oregon are not covered by any retirement plan at work. Most of the problem is due to lack of access, though some workers choose not to participate in 401(k)-style plans, in which workers typically shoulder at least half of the cost (Purcell 2009). In contrast, participation in traditional defined-benefit pensions is generally automatic and does not require explicit employee contributions, at least in the private sector.3
Table 5 shows the extent to which Oregon workers (age 25–64) are offered an employer-sponsored retirement plan and whether they actually enroll in (take-up) such a plan. A little less than two-thirds of all workers (64.2 percent) work for employers that sponsor a plan, and, given a take-up rate of 82.6 percent, just over half of all workers (53.0 percent) participate. Coverage is somewhat higher among full-time workers, 71.5 percent of whom work for employers that sponsor a plan. Given a take-up rate of 88.5 percent among those offered a plan, about 63.3 percent of full-time workers participate. Coverage is lower among all private-sector workers, 59.3 percent of whom work for employers that sponsor a plan, and 47.7 percent of whom participate.

Table 5 and Figure E also show that access to and participation in employer-sponsored retirement plans vary dramatically by income share—only about one in eight (12.9 percent) of private-sector workers in the bottom income quartile participates in an employer-sponsored retirement plan, compared with more than six in eight (76.3 percent) in the top income quartile. It is noteworthy that the increase in participation rates moving up the income scale is a function both of greater access to retirement plans by income (from 29.5 percent for the bottom quartile to 81.9 percent of the top quartile) and employee take-up (from 43.7 percent of the bottom quartile to 93.1 percent of the top quartile).
We also see significant variation in coverage when comparing firms of different sizes (see Table 5 and Figure F). As the firm size increases, so, too, does retirement plan coverage. Only 29.6 percent of employees of very small firms (those with 24 or fewer employees) work for employers that sponsor retirement plans, compared with 78.3 percent of employees of very large firms (those with 1,000 or more employees). Likewise, less than one quarter (22.2 percent) of employees of very small firms participate in employer-sponsored plans, compared with nearly two-thirds (64.4 percent) of employees of very large firms. Interestingly, employee take-up of retirement plan coverage doesn’t vary in a consistent pattern or direction. The determinant driving higher participation rates as firms increase in size is whether or not employees are offered access to retirement plans.

Conclusion
As baby boomers move into their retirement years, retirement security will continue to be an issue of growing concern in Oregon and throughout the United States.4
Social Security remains the predominant form of retirement income for the lowest quartile of retirees, disproportionately composed of women, while the top quartile has much higher access to private retirement funds. Increasing access to employer-sponsored retirement coverage, particular among lower income workers and those currently working for smaller employers, can greatly enhance future retirement security.
Acknowledgements
The authors would like to acknowledge and thank EPI colleagues Natalie Sabadish, Monique Morrissey, Jin Dai, and David Cooper for their contributions to this paper, and the financial support of SEIU Oregon State Council and AARP of Oregon.
Methodology
In this paper, our objective is to examine the income security of older Oregonians who no longer work in the formal labor market. We draw on 2002–11 data (reflecting 2001-10 survey responses) from the Annual Social and Economic Supplement to the U.S. Bureau of Labor Statistics’ Current Population Survey. To obtain reliable estimates for the state of Oregon, we combine 10 years of data to estimate income of current retirees and access to retirement plans among current workers. For the purposes of this analysis, retirees are defined as people age 60 and older who did not work during the reference period.
For the most part (89.8 percent of our weighted sample), respondents list “retired” as the reason for not working. The remainder list “ill/disabled” (7.6 percent), “taking care of home/family” (1.9 percent), “could not/unable to find work” (0.5 percent), and “other” (0.2 percent). We consider all of these people retired in the sense that they rely on nonwage income for their livelihood and may well rely only on nonwage income for the rest of their lives. However, some (including some self-described “retirees”) may eventually return to the labor force. That said, the results here differ only slightly from an analysis which restricts the sample to those who report only “retired.” Additionally, removing the restriction provides a more sufficient sample size for our socio-demographic breakdowns.
With the exception of the tables and charts comparing retiree income with the federal poverty level, the data used here rely on individual/personal income. Because one’s relationship to the federal poverty level is based on the income of their family unit, those data points, as indicated in the text, are based not on individual or personal income, but instead on family income.
In order to be included in our data, personal income must be greater than $0.00. Nearly all— 96 percent—of retirees (those 60 years old or older and not working) have positive income, while 3.9 percent have zero income, and .08 percent have negative income. The data presented here rely on the 96 percent with positive retirement income.
References
Bureau of Labor Statistics. 2002–2011. Current Population Survey, Annual Social and Economic Supplement, 2002–2011.
Morrissey, Monique. 2009. Working for a Universal, Secure, and Adequate Retirement System. Retirement USA; http://www.retirement-usa.org.
Purcell, Patrick. 2009. Retirement Savings and Household Wealth in 2007. Congressional Research Service Report for Congress. Washington, D.C.: CRS.
Short, Kathleen. 2011. “The Research Supplemental Poverty Measure: 2010.” U.S. Census Bureau, Current Population Reports. Washington, D.C.: U.S. Government Printing Office.
Endnotes
1. Retirement Funds include regular payments of income from employment-based retirement accounts including 401(k) accounts, or from other tax-preferred retirement savings such as IRAs. In this paper, we use the term retirement income as an aggregate term that includes income from retirement funds and all other sources of income for retirees (other than Social Security). Importantly, lump-sum payments from 401(k) or IRA accounts are not counted here as retirement funds.
2. Supplemental Security Income (SSI) is a federal income-supplement program designed to help aged, blind, and disabled people with little or no income, providing cash assistance to meet needs such as food, shelter, and clothing. SSI is funded through general revenues, not through Social Security taxes.
3. Most economists would agree that these contributions come out of other forms of compensation even if not explicitly taken out of wages.
4. For a general discussion of these growing challenges see Morrissey (2009).