Briefing Paper #271
There is currently much cautionary talk in policymaking circles regarding the dangers to the economy’s future health posed by crossing a specific threshold in the ratio between government debt and gross domestic product. These fears have been fueled by a recent report by researchers Carmen Reinhart and Kenneth Rogoff. Reinhart and Rogoff have recently engaged in a prodigious research effort aimed at collecting and analyzing economic data and financial crises across dozens of countries and hundreds of years. The most comprehensive repository of this work is their 2009 book This Time is Different: Eight Centuries of Financial Folly; a separate report “Growth in a Time of Debt” (GITD hereafter), based on a subset of their data on national debt and economic growth, has received considerable attention in the media and among policy makers after professor Reinhart testified at the National Commission on Fiscal Responsibility and Reform.1 The claim from GITD that has attracted the most attention is that there is no association between debt and growth at low or moderate levels of debt, but that there exists a well-defined threshold (90%, in their estimation) of government debt relative to gross domestic product (GDP) above which economic growth is hindered. Given that some projections of U.S. national debt over the coming decade show that this 90% threshold may well be exceeded,2 the GITD finding has been seized on by many to push for debt reduction and to argue for rapid, deep cuts in federal spending in order to keep the debt-to-GDP ratio from approaching this supposed benchmark.3 This paper demonstrates several theoretical and empirical flaws of the GITD approach and findings, especially as they relate to the U.S. economy. As a result, policymaking based on the findings of GITD would be deeply unwise, for a number of reasons, including:
- The GITD report examines yearly growth and debt levels, with no allowance for an impact over time, or a more complicated dynamic relation between growth and debt. There is no compelling theoretical reason why the stock of debt at a given point in time should harm contemporaneous economic growth. In this regard, the GITD findings are clearly out of step with academic research on government borrowing and economic growth.
- The empirical findings of GITD are very unlikely to be relevant to the United States economy of today. The United States has very limited experience with debt levels over 90%. In particular, the United States economy has only exceeded the 90% threshold in six of the 218 years examined in the GITD paper, and these six years are constituted by a single consecutive time-span in the 1940s dominated by the
- defense buildup and subsequent demobilization around World War II. The results for the United States are thus very sensitive to just a couple of years in the 1940s, and simply removing the influence of defense spending contributions to growth in this high-debt period actually results in GDP growth that is nearly double that of the lower-debt years. This means that there is very little actual evidence to suggest that a 90% debt ratio by itself has had any measurable effect on U.S. growth.
- The GITD threshold rests on a simple correlation of high debt levels with slower growth, but no evidence on causality is given. This is important given that contemporaneous causality is actually more likely to run in the opposite direction that what is claimed in the report. That is, causality is more likely to run from slow growth to high debt levels, and this alternative explanation is even supported in the GITD data.
- Finally, the study uses gross debt as their measure of federal debt, and thus they include intra-governmental holdings. However, the economic theory that links public borrowing to overall economic outcomes primarily works through an interest rate channel, and thus debt held by the public is a more appropriate measure for policy makers targeting any particular debt level. Because of limited data availability, the GITD paper is only able to base its conclusion on an analysis of gross debt rather than the more-appropriate measure, public debt. The debt that is economically relevant is the debt held by public, not the gross debt—thus using GITD findings to guide policy is problematic at best.
As a result, the GITD “90% threshold” for gross government debt should not be used as a guide for U.S. fiscal policy, as both the theory and the data in the paper rest on exceptionally shaky foundations. Given this, there is no justification for rapid, deep cuts to federal spending based on fears of exceeding this threshold. The rest of this paper demonstrates in more detail the flaws in the GITD approach and findings.
Background theory: Is it debt or deficits that matter for growth?
The terms “debt” and “deficit” are often used almost interchangeably in fiscal policy debates. To be clear, the federal budget deficit is simply the gap between flows of government revenues and outlays in a given year. The federal debt is the outstanding stock of government securities that were issued to finance past budget deficits. In years when revenues exceed outlays (i.e., when budget surpluses instead of deficits are accumulated), the overall debt actually falls. The theory underlying why federal borrowing can be bad for economic growth primarily concerns deficits, not debt. This theory argues that an increase in the federal budget deficit means that the government increases its demand for “loanable” funds from the private sector, looking to borrow money from its own citizens as well as from international investors. In a healthy economy, this means that the government begins competing with private borrowers for a fixed supply of savings, and thus drives up interest rates. This increase in interest rates may reduce (“crowd out”) private-sector investments in plants and equipment. This decline in investment means that the overall economy has a smaller capital stock with which to work, and this smaller capital stock decreases future growth rates.4 Note that the size of the nation’s outstanding debt plays no role in this account of borrowing and subsequent growth. So long as current flows of savings are not being claimed by government borrowing, no “crowd-out” occurs. To get a clearer sense of this, Table 1 compares the mid-1980s with the mid-1990s. The average debt-to-GDP ratio was clearly higher in the latter period, but because annual deficits were lower, most economists would have argued that much less crowding-out was occurring in the mid-1990s. Reflecting this theoretical presumption that it is annual deficits, not the outstanding stock of debt, that threaten future growth, most studies that claimed to have found a link between rising government borrowing and rising interest rates find only a link between deficits and interest rates, not interest rates and debt (see Gale and Orszag (2004) as a representative of such literature).
Theory: Debt leads to financial crises?
While most economists would concur that textbook presentations of the effect of government bo
rrowing on growth stress the importance of deficits, not debt, a number of economic observers have made the claim that rising debt levels can affect economic performance in non-standard ways. For example, Orszag, Rubin, and Sinai (2004) and Ball and Mankiw (1995) raise the specter that that rising debt levels could make investors wary that a nation will not be able to make debt-service payments to its creditors. The resulting flight of investors from the nation’s debt could cause interest rates to spike as higher returns had to be guaranteed to creditors to persuade them to keep financing a nation’s deficits. The interest rate spike would then lead to financial market “disarray” and hurt growth through this channel. While nobody would dispute that financial crises caused by excessive debt have inflicted large economic costs on many countries through time, these crises have generally not afflicted modern economies—like the United States’—that can borrow in their own currency and that have independent monetary and exchange rate policies. A review of the academic literature on sovereign debt defaults (Manasse and Roubini 2005) finds that it is exposure to currency risk that dominates the probability of debt default or financial crisis. This same review sets out a classification system to sort countries into those safe from debt crises versus those who are not safe—and the simple ratio of public debt to GDP is not found to be a useful predictor variable for this. Lastly, given that the market for U.S. treasuries is the most liquid and transparent market in the financial world, interest rates in this market should be a barometer of investors’ expectations about the prospect of the U.S. government being unable to service its debt. Today, interest rates in these markets are at historic lows, reflecting the very large demand by global investors who want to hold U.S. debt. In short, we seem very far from facing a financial crisis triggered by the unwillingness of these investors to hold U.S. debt (for more on why these low interest rates are a normal part of a recessionary economy, see Bivens (2010) and Irons (2010)).
Data: The United States debt above and below the threshold
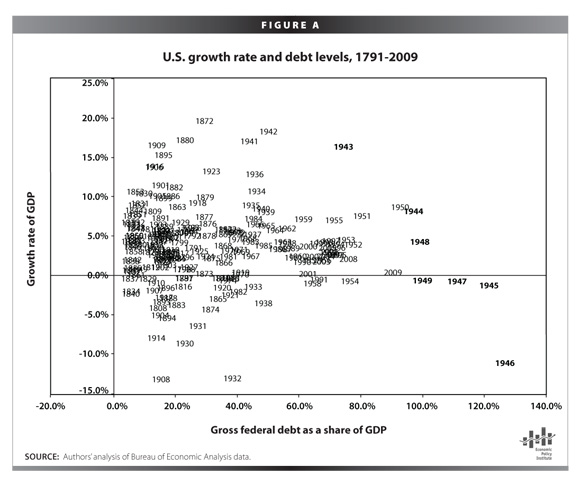
The GITD study is part of a larger research effort that collects data on dozens of countries across hundreds of years to document the rise and fall of debt. The 90% threshold is obtained by simply dividing their cross-country, historical data into four categories: debt that is between 0% and 30% of a country’s GDP, between 30% and 60%, between 60% and 90%, and finally debt that exceeds 90% of GDP. The research then simply examines the average growth rate of all country/year observations in each of the four categories. Importantly, the 90% level was not determined by the data, but rather by an arbitrary grouping of debt levels. For their entire sample and for the United States, there is no significant difference in the growth rates in any of the first three categories. But for both the entire sample and the United States, average growth rates in years where debt exceeds 90% of GDP are significantly lower. It should first be noted that this pattern is odd—very few economic relationships are posited to have this kind of “cliff” or “threshold” effect. If there is no difference in growth rates when nations’ debt rises from 0% to 31% to 61% of GDP it seems odd to see an effect kick-in when this debt to GDP ratio rises from 89% to 91%. To get a sense of the relevance of the GITD findings for the United States, we compiled data on debt and GDP for the United States from the same data sources. Figure A plots the growth rate and debt level in the United States for each year between 1791 and 2009 to see whether or not there seems to be a durable relationship between debt levels and growth. Clearly, there is no clear trend in the data showing that high debt levels lead to lower growth.
Figure A: U.S. growth rate and debt levels 1791-2009
Next, we replicated their debt-to-GDP categories and calculated average and median GDP growth rates in each category. The results are shown below in Table 2. While we do find a difference in growth rates for years with debt ratios exceeding 90%, the average growth rate in these years in our sample is slightly different from the GITD findings.5 What most stands out from this replication, however, is that the entire high-debt category for the United States is accounted for by one consecutive time-span in the 1940s that is dominated by the debt buildup and consequent demobilization surrounding World War II. During this six-year period, the United States de-mobilized from the war—defense spending as a share of overall GDP fell by more than 35 percentage points between 1943 and 1949. As a result of this historically unprecedented withdrawal of government spending to the economy, GDP contracted in 1945, 1946, and 1947. The 10.9% contraction in 1946, the first full post-WWII year, was the second largest annual contraction since the Bureau of Economic Analysis (BEA) began tracking GDP growth (the largest annual contraction was in 1932). Figure B plots overall GDP growth against the contribution of defense spending between 1943 and 1949. There is very little left to explain in terms of GDP growth once the influence of defense spending is factored in. In short, the 1943-49 growth performance of the United States is clearly not driven by its contemporaneous debt levels but is instead a simple function of the (massive) defense spending and de-mobilization that characterized this period. In fact, removing 1945 and 1946 from our sample, two years that saw defense spending contribute an average of negative 17 percentage points to overall growth, yields an average growth rate in the remaining years of 2.8%, below the rest-of-sample average but no longer negative. And if one removes the influence of defense spending in the entire high-debt sample, the average growth rate in that six-year period is 5.3%, well over the rest-of-sample average. The sensitivity of the overall results for the United States to outliers (like the 1945-46 data) is likely true for other countries as well. In the GITD data, nearly half of the advanced countries (six of 14) that had experienced high debt levels saw higher growth in the highest debt years than in at least one of the lower-debt categories.6 Obviously, generalizing from this data is problematic at best.
Data: Causality
Even if a durable correlation between high levels of debt and contemporaneous growth was found (contrary to most theoretical expectations), it still would not be a sound basis on which to draw policy conclusions. The analysis and rhetoric in GITD (and those who use it to buttress the case for rapid fiscal retrenchment) assumes that causality runs from higher debt levels to slower contemporaneous economic growth. The data, however, do not speak to causality, and there is considerable reason to believe that causality may run the exact opposite direction. First, the theory that governs the relation between debt and growth suggests strongly that causality runs more firmly from slower growth to higher debt loads. Slow economic growth, and especially growth that is slower than policy makers’ expectations, will lead to higher levels of debt as revenues fall and as automatic-stabilizer spending increases. High annual deficits that lead to higher debt loads may in theory (as described before) lead to higher interest rates and thus lower levels of privat
e investment and growth in the future. Importantly, the timing matters. Persistent slow growth will yield high debt levels, and will thus mechanically yield to contemporaneous combinations of high debt and slow growth. The impact of large annual deficits,
by contrast, would yield both slower growth and higher
levels of debt not contemporaneously, but in the future.
Very preliminary evidence on the issue of timing is presented below. Pairwise Granger-causality tests are performed on GDP growth and debt ratios for the entire sample (Table 3). We allowed the lag length to vary between two and 10 years. In every case we cannot reject the hypothesis that growth in debt ratios does not Granger-cause GDP growth. By contrast, we can reject the hypothesis that GDP growth does not Granger-cause a rise in the debt. In short, the statistical evidence strongly suggests that the causality runs from growth to debt, and not the reverse.Given that theory and preliminary investigation agree in this case, it seems clear that the GITD analysis—which looks only at contemporaneous levels of debt and growth—is much more likely to capture causal relationships running from slow growth to high debt.7 This means there is very little reason for policy makers to think that there is a high-debt threshold that acts to slow growth.
Data: Measure of debt
GITD looks at levels of gross debt over time and across countries. The authors rely on a data set that tracks gross debt levels. Gross debt includes the amount of debt held by the general public (such as individual investors, pensions funds, and foreign central banks), but it also includes intra-governmental holdings, including for
example, program-specific trust funds. For assessing the economic impact of federal debt, economists generally agree that debt held by the public (not gross debt) is the more correct measure because it shows the degree to which the federal government must rely on private savings (or the “bond market”) to finance borrowing. It is the competition for these private resources that could lead to higher interest rates and the so-called crowding out of private investments. Debt held in inter-governmental accounts does not have the same impact. This reliance on gross debt by GITD is likely due to a limitation of data sources. In an effort to compile a comprehensive data set over many years and over many countries in a way that would be comparable, using the gross debt measure became necessary. Since gross debt and debt held by the public are usually closely related (especially over very long periods of time and across countries), the choice is not unreasonable. And if arguments were being made about the trajectory of debt, the net and gross levels would be very tightly correlated. However, interpreting the results to imply that there is some well-defined threshold for debt that cannot be crossed, then the difference between gross and net debt could matter a lot. For example, the difference between gross debt and debt held by the public in the United States is substantial, a difference of more than $2 trillion, or 16% of GDP in 2009. Most of the difference between these two measures is accounted for by the large surplus generated by Social Security and held in the Social Security Trust Fund. This is money that the government is borrowing from itself, so it does not crowd out potential private borrowers.
Conclusion
The larger research effort undertaken by Reinhart and Rogoff to gather data on debt and growth across countries and time has yielded many valuable insights. However, the shakiest inference from this research effort—the claim that there is a well-defined ratio of debt to GDP above which economic growth suffers—has dominated discussion of this work both in the media and in policymaking circles. This paper has shown that there is no compelling reason to believe the most frequently cited claim from GITD that gross debt of about 90% will necessarily lead to slower economic growth. In fact, there is little in economic theory, or in the data presented for the United States, that supports this proposition. While we do believe that projected unsustainable deficits in coming decades should be addressed, there is no solid evidence that we are approaching a tipping point. In fact, the greatest threat to economic growth is policy inaction fueled by deficit fears.
Endnotes
Meeting on May 26, 2010. Video can be found at http://www.fiscalcommission.gov/meetings/.
The 90% threshold will likely be exceeded in 2010 or 2011 if measured as gross debt, and in 2020 if measured as debt held by the public. GITD uses the gross debt measure in their analysis.
See, for example, “Senator Gregg’s Senate Floor Remarks on the Conrad-Gregg Amendment to the Debt Limit Bill” January 21, 2010 (unofficial transcript) at http://budget.senate.gov/republican/pressarchive/2010-01-21Floor.pdf; and remarks of members of the Commission on Fiscal Responsibility and Reform as reported in The Fiscal Times, “Alarming Gross Debt Sparks Fiscal Commission Debate” May 27, 2010, at http://www.thefiscaltimes.com/Issues/Budget-Impact/2010/05/27/Alarming-Gross-Debt-Sparks-Fiscal-Commission-Debate.aspx
This is the closed-economy analysis of how deficits affect growth. If foreign lenders step up and provide as much funding as is necessary at unchanged interest rates as the government increases its deficits, this keeps the size of the domestic capital stock from growing more slowly over time. But a growing share of this capital stock will be owned by foreign lenders, keeping domestic incomes growing more slowly than they would have absent the government’s increased borrowing.
We believe the difference is that, in our sample, 1944 is a year that exceeds the 90% threshold (with debt coming in at 91.5% of GDP). If we exclude this year from our high-debt category, we get average and median growth numbers that match the GITD results almost exactly. We experimented with dividing our annual debt measures into quarters and then lagging them one quarter so as to better fit our calendar-year data onto fiscal years. When we do this, the 1944 debt level drops just below the 90% threshold. The actual data used in the GITD study have not been made available to the public by the authors.
See GITD, Table 1.
The exception to this general rule is a debt-fueled crisis, which could produce contemporaneous levels of slow growth and high-debt. However, the GITD paper does not attempt to use the data to predict crises (which would typically be rare and low-probability), and rather relies on median measures that would, by design, factor out a few dramatic dips.
References
Ball, Lawrence, and N. Gregory Mankiw. 1995. “What do Budget Deficits Do?” NBER Working Paper #5263. Cambridge, Mass.
Bivens, Josh. 2010. “Budget deficits and interest rates.” Briefing Paper #262. Washington, D.C.: Economic Policy Institute.
Irons, John. 2010. “No crisis in confidence—Evidence shows U.S. creditors still think U.S. debt remains safest in world.” Issue Brief #276. Washington, D.C.: Economic Policy Institute.
Gale, William, and Peter Orsag. 2004. “Budget Deficits, National Savings, and Interest Rates.” Brookings Papers on Economic Activity, Volume 2.
Manasse, Paolo, and Nouriel Roubini. 2005. “Rules of Thumb for Sovereign Debt Crises.” International Monetary Fund Working Paper.Washington, D.C.: IMF.
Orszag, Peter, Allen Sinai, and Robert Rubin. 2004. &ldqu
o;Sustained Budget Deficits: Longer-Run U.S. Economic Performance and the Risk of Financial and Fiscal Disarray.” Paper presented at 2004 AEA-NAEFA Session at the ASSA meetings, San Diego.
Reinhart, Carmen M., and Kenneth S. Rogoff. 2009. “Growth in a Time of Debt.” prepared for the American Economic Review Papers and Proceedings, at http://www.aeaweb.org/aea/conference/program/retrieve.php?pdfid=460.