Briefing Paper #188
October 9, 2007 (revised) (originally released May 2, 2007)
Contrary to the predictions of its supporters, China’s entry into the World Trade Organization (WTO) has failed to reduce its trade surplus with the United States or increase overall U.S. employment. The rise in the U.S. trade deficit with China between 1997 and 2006 has displaced production that could have supported 2,166,000 U.S. jobs. Most of these jobs (1.8 million) have been lost since China entered the WTO in 2001. Between 1997 and 2001, growing trade deficits displaced an average of 101,000 jobs per year, or slightly more than the total employment in Manchester, New Hampshire. Since China entered the WTO in 2001, job losses increased to an average of 353,000 per year—more than the total employment in greater Akron, Ohio. Between 2001 and 2006, jobs were displaced in every state and the District of Columbia. Nearly three-quarters of the jobs displaced were in manufacturing industries. Simply put, the promised benefits of trade liberalization with China have been unfulfilled.
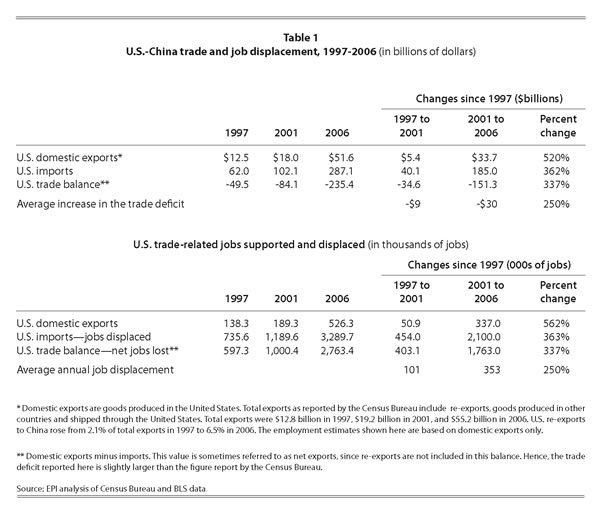
As a matter of policy, China tightly pegs its currency’s value to that of the dollar at a rate that encourages a large bilateral surplus with the United States. Maintaining this peg required the purchase of about $200 billion in U.S. Treasury Bills and other securities in 2006 alone.1 This intervention makes the yuan artificially cheap and provides an effective subsidy on Chinese exports; best estimates are that the rate of this effective subsidy is roughly 40%. China also engages in extensive suppression of labor rights; it has been estimated that wages in China would be 47% to 85% higher in the absence of labor repression. China has also been accused of massive direct subsidization of export production. Finally, it maintains strict, non-tariff barriers to imports. As a result, China’s exports to the United States of $288 billion in 2006 were six times greater than U.S. exports to China, which were only $52 billion (Table 1). China’s trade surplus was responsible for 42.6% of the United States’ total, non-oil trade deficit. This is by far the United States’ most imbalanced trading relationship. Unless and until China revalues (raises) the yuan and eliminates these other trade distortions, the U.S. trade deficit and job losses will continue to grow rapidly in the future.
Major findings of this study:
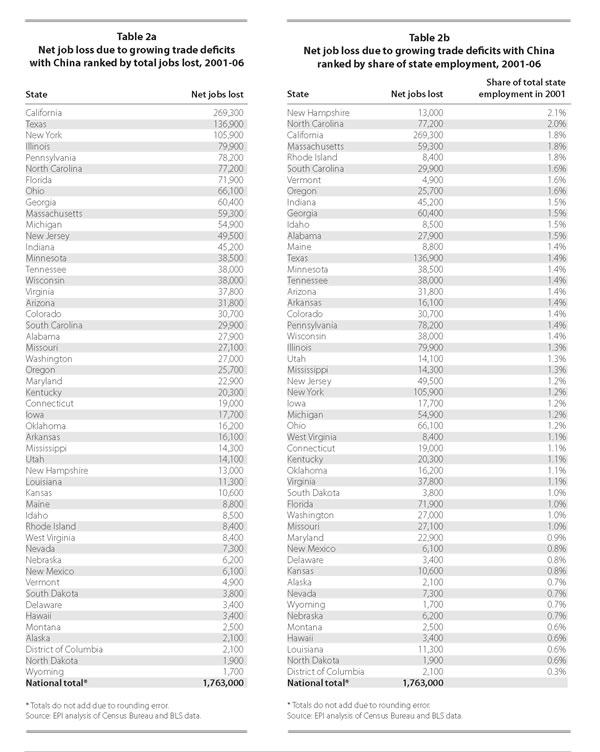
- The 1.8 million jobs opportunities lost nationwide since 2001 are distributed among all 50 states and the District of Columbia, with the biggest losers, in numeric terms: California (-269,300), Texas (-136,900), New York (-105,900), Illinois (-79,900), Pennsylvania (-78,200), North Carolina (-77,200), Florida (-71,900), Ohio (-66,100), Georgia (-60,400), and Massachusetts (-59,300) (Table 2A).
- The 10 hardest-hit states, as a share of total state employment, are: New Hampshire (-13,000, -2.1%), North Carolina (-77,200, -2.0%), California (-269,300, -1.8%), Massachusetts (-59,300, -1.8%), Rhode Island (-8,400, -1.8%), South Carolina (-29,200, -1.6%), Vermont (-4,900, -1.6%), Oregon (-25,700, -1.6%), Indiana (-45,200, -1.5%), and Georgia (-60,400, -1.5%) (Table 2B).
China’s entry into the WTO was supposed to bring it into compliance with an enforceable, rules-based regime, which would require that it open its markets to imports from the United States and other nations. The United States also negotiated a series of special safeguard measures designed to limit the disruptive effects of surging Chinese imports on domestic producers. However, the core of the agreement failed to include any protections to maintain or improve labor or environmental standards. As a result, China’s entry into the WTO has further tilted the international economic playing field against domestic workers and firms, and in favor of multinational companies (MNCs) from the United States and other countries, and state- and privately-owned exporters in China. This has increased the global “race to the bottom” in wages and environmental quality and caused the closing of thousands of U.S. factories, decimating employment in a wide range of communities, states, and entire regions of the United States.
False promises
Proponents of China’s entry into the WTO frequently claimed that it would create jobs in the United States, increase U.S. exports, and improve the trade deficit with China. President Clinton claimed that the agreement allowing China into the WTO, which was negotiated during his administration, “creates a win-win result for both countries” (Clinton 2000, 9). He argued that exports to China “now support hundreds of thousands of American jobs” and that “these figures can grow substantially with the new access to the Chinese market the WTO agreement creates” (Clinton 2000, 10). Others in the White House, such as Kenneth Liberthal, the special advisor to the president and senior director for Asia affairs at the National Security Council, echoed Clinton’s assessment:
Let’s be clear as to why a trade deficit might decrease in the short term. China exports far more to the U.S. than it imports [from] the U.S….It will not grow as much as it would have grown without this agreement and over time clearly it will shrink with this agreement.2
Promises about jobs and exports misrepresented the real effects of trade on the U.S. economy: trade both creates and destroys jobs. Increases in U.S. exports tend to create jobs in the United States, but increases in imports tend to destroy jobs as imports displace goods that otherwise would have been made in the United States by domestic workers.
The impact of changes in trade on employment is estimated here by calculating the labor content of changes in the trade balance—the difference between exports and imports. Each $1 billion in computer exports to China from the United States supports American jobs. However, each $1 billion in computer imports from China displaces those American workers, who would have been employed making them in the United States. On balance, the net employment effect of trade flows depends on the growth in the trade deficit; not just exports. Another critically important promise made by the promoters of liberalized U.S.-China trade was that the United States would benefit because of increased exports to a large and growing consumer market in China. This market, in turn, was to be based on an expansion of the middle class that, it was claimed, would grow rapidly due to the wealth created in China by its entry into the WTO. However, the increase in U.S. exports to China has been overwhelmed by the growth of U.S. imports, as shown below.
Growing trade deficits and job losses
The U.S. trade deficit with China has increased from $50 billion in 1997 to $235 billion in 2006, an increase of $185 billion, as shown in Table 1. Between 1997 and 2001, prior to China’s entry into the WTO, the deficit increased $9 billion per year on average. Between 2001 and 2006, after China entered the WTO, the deficit increased $30 billion per year on ave
rage.
While it is true that exports support jobs in the United States, it is equally true that imports displace them. The net effect of trade flows on employment must look at the trade balance. The employment impacts of growing trade deficits are estimated in this paper using an input-output model that estimates the direct and indirect labor requirements of producing output in a given domestic industry. The model includes 200 U.S. industries, 86 of which are in the manufacturing sector (see this paper’s methodology appendix for further details).3
The model estimates the labor that would be required to produce a given volume of exports, and the labor that is displaced when a given volume of imports is substituted for domestic output.4 The job losses presented here represent an estimate of what sectoral employment levels would have been in the absence of growing trade deficits.5
U.S. exports to China in 1997 supported 138,000 jobs, but U.S. imports displaced production that would have supported 736,000 jobs, as shown in the bottom half of Table 1. Therefore, the $49 billion trade deficit in 1997 displaced 736,300 jobs in that year. Job displacement rose to 1,000,000 jobs in 2001 and 2,763,000 in 2006. Prior to China’s entry into the WTO, an average of 101,000 jobs per year were displaced by growing trade deficits between 1997 and 2001. After 2001, an average of 353,000 jobs per year were lost.
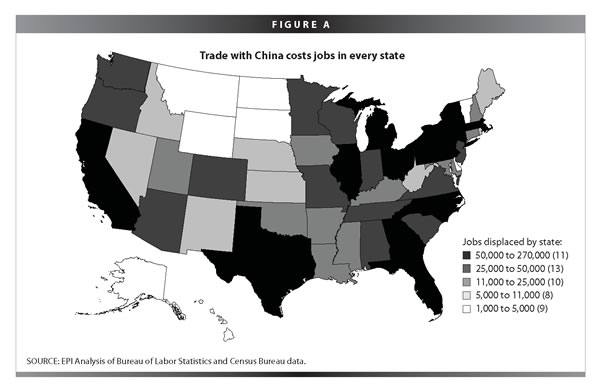
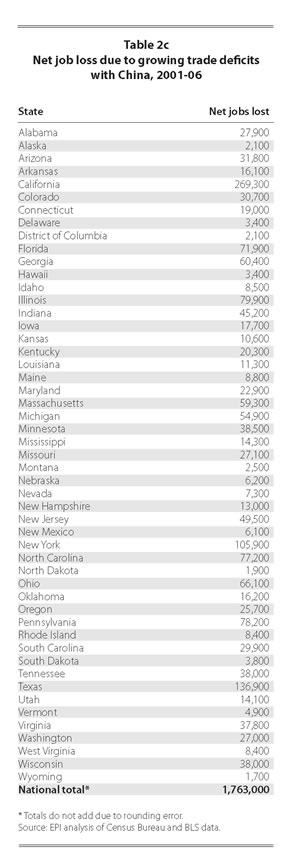
Growth in trade deficits with China has reduced demand for goods produced in every region of the United States and has led to job displacement in all 50 states and the District of Columbia, as shown in Table 2A and Figure A.6 More than 100,000 jobs were lost in California, Texas, and New York each. Jobs displaced due to growing deficits with China equaled or exceeded 2.0% of total employment in states such as North Carolina and New Hampshire, as shown in Table 2B. An alphabetical list of job losses by state is shown in Table 2C.
Growing trade deficits with China have clearly reduced domestic employment in traded goods industries, especially in the manufacturing sector, which has been hard hit by plant closings and job losses. Workers displaced by trade from the manufacturing sector have been shown to have particular difficulty in securing comparable employment elsewhere in the economy. More than one-third of workers displaced from manufacturing drop out of the labor force (Kletzer 2001, 101, Table D2). Average wages of those who secured re-employment fell 11% to 13%. Trade-related job displacement pushes many workers out of good jobs in manufacturing and other trade-related industries, often into lower-paying industries and frequently out of the labor market.
Some economists have quibbled with job-loss numbers extrapolated from trade flows, based on the presumption that aggregate employment levels in the United States are set by a broad range of macroeconomic influences, not just by trade flows. There is a grain of truth to this—the trade balance is but one of many variables affecting aggregate job creation in the United States.
That said, the employment impacts of trade identified in this paper can be interpreted as the “all else equal” effect of trade on domestic employment. The Federal Reserve, for example, may decide to cut interest rates to make up for job loss stemming from deteriorating trade balances (or any other economic influence), leaving net employment unchanged. This, however, does not change the fact that trade deficits by themselves are a net drain on employment.
Administration officials and other economists have argued that the capital inflow that is the mirror-image of trade deficits supports jobs in the United States by keeping interest rates lower than they would be absent this inflow. During the late 1990s, for example, these capital inflows fought rising trade deficits to a draw in terms of aggregate employment effects, and, through much of the 2000s recovery, interest-sensitive industries (housing and construction, for example) have surely expanded more than they would have absent foreign capital inflows. While these claims may be correct from a simple accounting standpoint, they do not support assertions that trade flows are a useless indicator of job loss.
First, and most simply, it is just not true that foreign capital inflows always make up trade-induced employment losses one-for-one. In the 2001 recession and the jobless recovery following, growing trade deficits accompanied aggregate job loss, even as interest rates scraped historical bottoms. Clearly, low interest rates do not always translate into enough growth in investment and consumption in interest-sensitive sectors to always sterilize the impact of growing trade deficits.
Second, the job-loss numbers identified in this report are a good measure of just how unbalanced the U.S. economy has become due to rising trade deficits. Tradable goods industries have hemorrhaged jobs, while interest-sensitive, often non-tradable, industries have seen rapid growth. At that point in the future when trade deficits begin to close (and this will happen—it is only a question of when and how), the U.S. economy will need to return many of the jobs displaced by rising trade deficits out of non-tradable and into tradable industries. Moving millions of workers back and forth between sectors is no mean trick, and accomplishing it without a recession in between will be hard; trying to do it after another couple of years of deficit growth—and an even more lopsided U.S. economy—will be even harder.
In short, while aggregate employment in the United States may well not respond job-for-job with the numbers reported in this paper on trade deficits with China, these numbers provide insight into how much harder other macroeconomic influences have to work to eliminate the employment drag from these deficits, and they provide a good (and ominous) measure of how lopsided employment growth in the U.S. economy has become owing to the unbalanced U.S.-China trade relationship.
Conclusion
The growing U.S. trade deficit with China has displaced huge numbers of jobs in the United States, and been a prime contributor to the crisis in manufacturing employment over the past six years. The current U.S.-China trade relationship is bad for both countries. The United States is piling up foreign debt, losing export capacity, and facing a more fragile macroeconomic environment. Meanwhile, China has become dependent on the U.S. consumer market for employment generation, has suppressed the purchasing power of its own middle class with a weak currency, and, most importantly, has held hundreds of billions of hard-currency reserves in low-yielding, risky assets, instead of investing them in public goods that could benefit Chinese households. Its repression of labor rights has suppressed wages, thus subsidizing its exports and making them artificially cheap. This relationship needs a fundamental change: addressing the exchange rate policies and labor standards issues in the Chinese economy are important first steps.
April 2007
The author thanks Lauren Marra for her research assistance
and Josh Bivens and Ross Eisenbrey for comments.
This research was made possible by generous support
from the Alliance for American Manufacturing.
lass=”heading3″>Methodology
This analysis utilizes an input-output model to estimate the relationships between changes in trade flows and production that could support domestic employment. The analysis covers trends in goods trade, which is dominated by manufactures. Services trade is not considered because of problems with the data, and because many of the services traded involve returns to capital and intellectual property that have little or no direct effect on employment. In addition, goods trade dominates the nation’s international accounts.
This study uses the model developed in Rothstein and Scott (1997a and 1997b). This approach solves four problems that are prevalent in previous research on the employment effects of trade. Some studies look only at the effects of exports and ignore imports. Some studies include re-exports (transshipments)—goods produced outside the United States and shipped through this country to other nations—as U.S. exports. The trade data used in many studies is usually not adjusted for inflation. Finally, a single employment multiplier is often applied to all industries, despite differences in labor productivity and utilization.7
The model used here is based on the Bureau of Labor Statistics’ employment requirements tables, which were derived from the U.S. input-output tables that are published by the Bureau of Economic Analysis. These tables are adjusted to 2000 price and productivity levels (BLS 2007b), in real, chain-weighted 2000 dollars. A base year with 2000 employment requirements was used to estimate the employment content of trade in all years covered in this study. This assumption was needed to control for the effects of technology. This technique isolates the effects of trade on employment from pure technology effects. This model is used to estimate the direct and indirect effects of changes in goods trade flows in each of 200 industries. This study updates the 1987 input employment requirements table used in earlier reports in this series (Rothstein and Scott 1997a, 1997b).
This analysis requires four-digit, trade data based on the North American Industry Classification System (NAICS) (U.S. International Trade Commission 2007), deflated with industry-specific, chain-weighted price indices (BLS 2007a), which were updated using industry-specific producer price indexes (BLS 2007b).8 Trade data were downloaded from the U.S. International Trade Commission (2007) Web site in NAICS format. The data for 2006 are preliminary estimates; this report will be updated and expanded when the final 2006 trade data are released in June 2007. State-level employment effects are calculated by allocating imports and exports to the states on the basis of their share of four-digit, industry-level employment for 2000 (U.S. Census Bureau 2001).
The trade data were converted into chain-weighted 2000 dollars. A domestic employment requirements table for a particular base year was used to estimate the employment effects of trade in each year of the analysis, holding technology constant. The domestic employment requirement calculates the labor required to produce all of a given product within the United States. Thus, it reflects the complete labor content of output, including jobs indirectly supported in service industries. The base year of 2000 was chosen for this study because it was an approximate mid-point in the data covered in this study.
CPS data on employment by industry by was collected for each of the detailed sectors in the model. These data were used to calculate each state’s share of national employment.
References
Bureau of Labor Statistics, Office of Employment Projections. 2007a. Special Purpose Files—Industry Output and Employment. Washington, D.C.: U.S. Department of Labor.
http://www.bls.gov/emp/empind2.htm.
Bureau of Labor Statistics, Office of Employment Projections. 2007b. Special Purpose Files— Employment Requirements. Washington, D.C.: U.S. Department of Labor.
http://stats.bls.gov/emp/empind4.htm.
Bureau of Labor Statistics. 2005. Access to historical data for the “B” tables of the Employment Situation News Release.
http://stats.bls.gov/ces/cesbtabs.htm.
Clinton, William J. 2000. Expanding trade, protecting values: Why I’ll fight to make China’s trade status permanent. New Democrat, Vol. 12, No. 1, pp. 9-11.
http://www.ndol.org/ndol_ci.cfm?contentid=965&kaid=108&subid=127
Faux, Jeff. 2007. Globalization That Works for Working Americans. Briefing Paper #179. Washington, D.C.: Economic Policy Institute. http://www.sharedprosperity.org/bp179.html.
Kletzer, Lori G. 2001. Job Loss From Imports: Measuring the Costs. Institute for International Economics. Washington, D.C.: IIE.
http://bookstore.petersoninstitute.org/book-store/110.html
Ratner, David. 2006. “Appendix: Methodology and Data Sources”, in Faux, Jeff, Bruce Campbell, Carlos Salas, and Robert Scott. 2006. Revisiting NAFTA: Still Not Working for North America’s Workers. Briefing Paper. Washington, D.C.: Economic Policy Institute.
http://www.epi.org/content.cfm/bp173
Rothstein, Jesse and Robert E. Scott. 1997a. NAFTA’s Casualties: Employment Effects on Men, Women, and Minorities. Issue Brief. Washington, D.C.: Economic Policy Institute.
http://www.epi.org/content.cfm/issuebriefs_ib120
Rothstein, Jesse and Robert E. Scott. 1997b. NAFTA and the States: Job Destruction is Widespread. Issue Brief. Washington, D.C.: Economic Policy Institute.
http://www.epi.org/content.cfm/issuebriefs_ib119
Scott, Robert E. 2005. U.S.—China Trade, 1989-2003: Impact on Jobs and Industries, Nationally and State-by-State. Working Paper # 270. Washington, D.C.: Economic Policy Institute. January.
http://www.epi.org/content.cfm/wp270
U.S. Census Bureau. 2001. 2000 Basic Monthly Survey of the Current Population Survey. U.S. Department of Commerce, U.S. Census Bureau. Washington, D.C.: U.S. Department of Commerce.
http://www.census.gov/cps/
U.S. International Trade Commission. 2007. USITC Interactive Tariff and Trade Data Web.
http://dataweb.usitc.gov/scripts/user_set.asp.
Endnotes
1. These purchases financed about one-quarter of the U.S. $857 billion current account deficit in 2006 (the broadest measure of all U.S. trade and income flows). But for these purchases, the reduced demand would have put significant downward pressure on the U.S. dollar. A substantial depreciation in the dollar would begin to improve the U.S. trade deficit within a few years.
2. NewsHour with Jim Lehrer
transcript. 1999. “Online NewsHour: Opening Trade—November 15, 1999.”
http://www.pbs.org/newshour/bb/asia/july-dec99/wto_11-15.html.
3. See Ratner (2006) for a more complete, technical description of this model.
4. For the purposes of this report, it is necessary to distinguish between exports produced domestically and re-exports—which are goods produced in other countries, imported into the United States, and then re-exported to other countries, in this case to China. Since re-exports are not produced domestically, their production does not support domestic employment and they are excluded from the model used here. See Table 1 for information about the levels of U.S. re-exports to China in this period.
5. This model assumes that everything else is held constant and the results are counterfactual estimates.
6. See the methodology appendix for computational details.
7. Other studies—see California State World Trade Commission (1996), which finds 47,600 jobs created in California from increased trade with Canada alone—have allocated all employment effects to the home state of the exporting company. This is problematic, because the production—along with any attendant job effects—need not have taken place in the exporter’s state. If a California dealer buys cars from Chrysler and sells them to China, these studies will find job creation in California. However, the cars are not made in California; so the employment effects should instead be attributed to Michigan and other state with high levels of auto industry production. Likewise, if the same firm buys auto parts from China, the loss of employment will occur in auto-industry states, not in California.
8. Industry-specific producer price indices are unavailable for certain industries between 2005 and 2006. In order to construct price deflators for all 200 BLS industries, we used a combination of commodity PPIs and industry PPIs. For instance, NAICS-based industry 3331 (which maps to BLS industry 72) is composed of agricultural, manufacturing, and mining machinery manufacturing. To compute a price index for this industry, a trade-weighted average of the commodity indices for agricultural machinery and construction machinery was used as a proxy for the industry PPI. Industry PPIs were used wherever available.