Joblessness remains at historic levels and there is no evidence UI is disincentivizing work: Congress must extend the extra $600 in UI benefits
Last week 2.3 million workers applied for unemployment insurance (UI) benefits. This is the 18th week in a row that unemployment claims have been more than twice the worst week of the Great Recession. Many headlines this morning are saying there were 1.4 million UI claims last week, but that’s not the right number to use. For one, it ignores Pandemic Unemployment Assistance (PUA), the federal program for workers who are not eligible for regular UI, like the self-employed. It also uses seasonally adjusted data for regular state UI, which is distorted right now because of the way the Department of Labor (DOL) does seasonal adjustments.
Of the 2.3 million workers who applied for UI last week, 1.37 million applied for regular state unemployment insurance (not seasonally adjusted), and 975,000 applied for PUA.
A disaster of Congress’s making is looming for those who have lost their livelihoods during the global pandemic and are now depending on UI to provide for their families. If Congress doesn’t act immediately, the across-the-board $600 increase in weekly unemployment benefits will expire at the end of this week. That would not just be cruel, it would be terrible economics. These benefits are supporting a huge amount of spending by people who would otherwise have to cut back dramatically. That spending is supporting more than 5 million jobs. If Congress kills the $600, they kill those jobs. Figure A shows the number of jobs that will be lost in each state if the $600 is allowed to expire.
If the $600 weekly unemployment insurance increase is allowed to expire, how many jobs will it cost over the next year?: Jobs cost as a level and as a share of employment
| State | Jobs cost | Jobs cost, as a share of employment |
|---|---|---|
| Alabama | 43,261 | 2.1% |
| Alaska | 12,458 | 3.8% |
| Arizona | 55,566 | 1.9% |
| Arkansas | 29,984 | 2.3% |
| California | 836,142 | 4.7% |
| Colorado | 66,898 | 2.4% |
| Connecticut | 74,689 | 4.4% |
| Delaware | 14,621 | 3.1% |
| Washington D.C. | 19,611 | 2.4% |
| Florida | 244,921 | 2.7% |
| Georgia | 186,605 | 4.0% |
| Hawaii | 32,751 | 5.0% |
| Idaho | 10,049 | 1.3% |
| Illinois | 195,149 | 3.2% |
| Indiana | 59,443 | 1.9% |
| Iowa | 42,580 | 2.7% |
| Kansas | 26,089 | 1.8% |
| Kentucky | 49,751 | 2.6% |
| Louisiana | 81,945 | 4.1% |
| Maine | 18,025 | 2.8% |
| Maryland | 67,486 | 2.4% |
| Massachusetts | 157,162 | 4.2% |
| Michigan | 194,520 | 4.4% |
| Minnesota | 107,633 | 3.6% |
| Mississippi | 42,744 | 3.7% |
| Missouri | 59,410 | 2.0% |
| Montana | 11,800 | 2.4% |
| Nebraska | 15,422 | 1.5% |
| Nevada | 84,166 | 5.9% |
| New Hampshire | 26,941 | 3.9% |
| New Jersey | 147,911 | 3.5% |
| New Mexico | 29,012 | 3.3% |
| New York | 463,968 | 4.7% |
| North Carolina | 142,496 | 3.1% |
| North Dakota | 9,293 | 2.1% |
| Ohio | 129,599 | 2.3% |
| Oklahoma | 46,018 | 2.7% |
| Oregon | 115,599 | 5.9% |
| Pennsylvania | 252,642 | 4.1% |
| Rhode Island | 20,228 | 4.0% |
| South Carolina | 54,484 | 2.5% |
| South Dakota | 5,107 | 1.1% |
| Tennessee | 80,269 | 2.5% |
| Texas | 364,576 | 2.8% |
| Utah | 20,728 | 1.3% |
| Vermont | 11,831 | 3.8% |
| Virginia | 106,549 | 2.6% |
| Washington | 122,224 | 3.5% |
| West Virginia | 22,606 | 3.2% |
| Wisconsin | 65,635 | 2.2% |
| Wyoming | 4,597 | 1.6% |

Notes: We take the relationship between the unemployment rate and the boost to personal income from the extra $600 payment that held in May of 2020 and assume it continues going forward as benefits are extended past July. We apply a multiplier of 1.5 to the personal income boost provided by enhanced UI. We then divide this boost by overall GDP, and apply the resulting percentage change to the average level of employment in the first quarter of 2020 to get an implied employment boost. The numbers in the chart are the average boost to personal income, GDP, and employment between the third quarter of 2020 and the second quarter of 2021. Some quarters would see even larger effects.
Source: Author’s analysis based on data from the National Income and Product Accounts (NIPA) data from the Bureau of Economic Analysis (BEA), projections from the Congressional Budget Office (CBO), data on continuing unemployment insurance claims from the Department of Labor (DOL), and total nonfarm employment from the Bureau of Labor Statistics (BLS) Current Employment Statistics (CES).
Many are talking about the potential work disincentive of the extra $600, since the additional payment means many people have higher income on unemployment insurance than they did from their prior job. The concern about the disincentive effect has been massively overblown. In May and June—with the $600 in place—7.5 million people went back to work. And about 70% of likely UI recipients who returned to work were making more on UI than their prior wage. Concerns about the work disincentive simply ignore the realities of the labor market for working people, who will be very unlikely to turn down a job for a temporary boost in benefits—particularly when it is now clear that jobs are going to be scarce for a very long time.
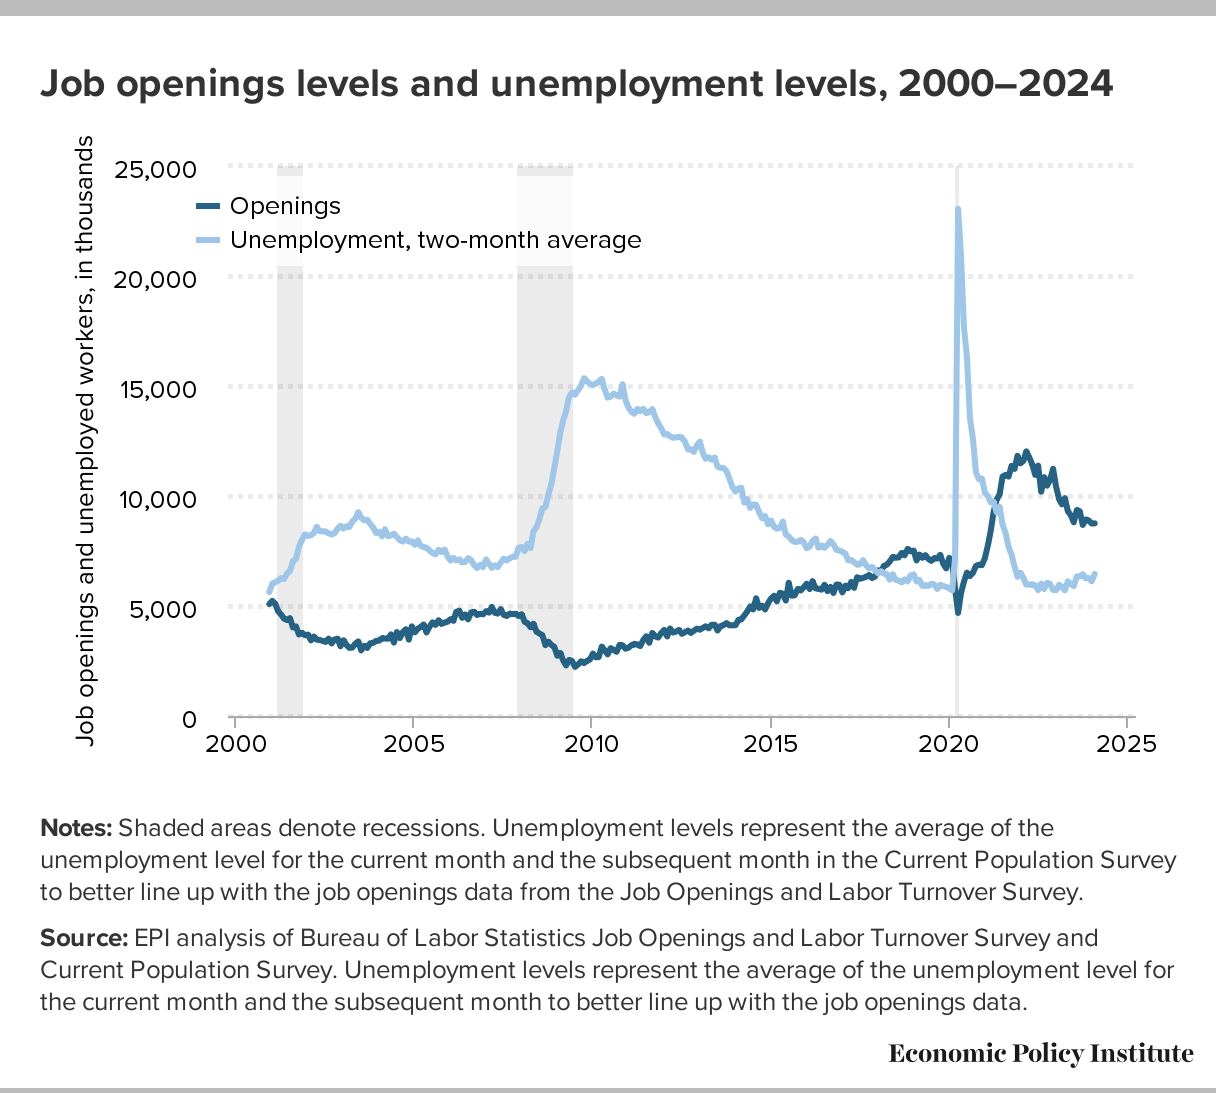
Further, there are 14 million more unemployed workers than job openings, meaning millions will remain jobless no matter what they do. Cutting off the $600 cannot incentivize people to get jobs that aren’t there.
Even further, many people are simply unable to take a job right now because it’s not safe for them or their family, or because they have care responsibilities as a result of the coronavirus. Cutting off the $600 cannot incentivize them to get jobs; it will just cause pain.
If policymakers insist on ignoring the evidence and worrying about the theoretical work disincentive of the $600, they should address their concern by letting people keep some of their UI when they go back to work—not by cutting off the $600, which is keeping the economy afloat.
Cutting off the $600 will also exacerbate racial inequality. Due to the impact of historic and current systemic racism, Black and Brown communities are suffering more from this pandemic, and have less wealth to fall back on. They will take a much bigger hit if the $600 expires. This is particularly true for Black and Brown women and their families, because in this recession, these women have seen the largest job losses of all.
And Congress needs to act immediately. If they let the extra payments expire and then reinstate them, it will be a needless administrative nightmare for state agencies, and recipients—who will face a lapse in benefits of several weeks in most states—will pay the price. It may already be too late in many states.
Figure B combines the most recent data on both continuing claims and initial claims to get a measure of the total number of people “on” unemployment benefits as of July 18. DOL numbers indicate that right now, 34.3 million workers are either on unemployment benefits, have been approved and are waiting for benefits, or have applied recently and are waiting to get approved. But a note of caution: Figure B provides an “upper bound” on the number of people receiving the $600, for three reasons (unfortunately, we only know the magnitude of the first one): (1) It includes initial claims, which represent people who have not yet made it through the first round of processing. (2) Some individuals may be being counted twice. Regular state UI and PUA claims should be nonoverlapping—that is how DOL has directed state agencies to report them—but some states may be misreporting. (3) Some states are likely including some back weeks in their continuing PUA claims, which would also lead to double counting (the discussion around Figure 3 in this paper covers this issue well).
DOL reports that 34.3 million workers are either on unemployment benefits or have applied and are waiting to see if they will get benefits: July 18, 2020
| Regular state UI: Continued claims | Regular state UI: Initial claims | PUA: Continued claims | PUA: Initial claims | Other programs (mostly PEUC and STC) | Total | |
|---|---|---|---|---|---|---|
| Cumulative | 16,390,919 | 1,370,947 | 13,179,880 | 1,930,271 | 1,434,063 | 0 |
Notes: This is an upper bound on the number of people “on” UI, for two reasons: (1) regular state UI and PUA claims should be nonoverlapping—that is how DOL has directed agencies to report them—but some individuals may be being counted twice; (2) some states are likely including some back weeks in their continuing PUA claims, which would also lead to double counting.
Notes: This is an upper bound on the number of people “on” UI, for two reasons: (1) regular state UI and PUA claims should be nonoverlapping—that is how DOL has directed agencies to report them—but some individuals may be being counted twice; (2) some states are likely including some back weeks in their continuing PUA claims, which would also lead to double counting. Non-seasonally-adjusted data are used throughout. Regular state UI continued claims are for the week ending July 11; regular state UI initial claims are for the week ending July 18. PUA continued claims are for the week ending July 4; PUA initial claims are for the weeks ending July 11 and July 18. “Other programs” are continued claims in other programs for the week ending July 4. Pandemic Unemployment Assistance (PUA) is the federal program for workers who are out of work because of the virus but who are not eligible for regular state unemployment insurance (UI) benefits (e.g., the self-employed). “Other programs” includes PEUC, STC, and others; a full list can be found in the bottom panel of the table on page 4 at this link: https://www.dol.gov/ui/data.pdf.
Source: Department of Labor (DOL) Unemployment Insurance Weekly Claims (News Release), retrieved from DOL, https://www.dol.gov/ui/data.pdf, July 23, 2020.
Figure C shows continuing claims in all programs over time (the latest data are for July 4). Continuing claims are more than 30 million above where they were a year ago. However, the above caveat about continuing PUA claims applies here too, which means the trends over time should be interpreted with caution.
Continuing unemployment claims in all programs: January 4, 2020–July 4, 2020
| Regular state UI | PUA | Other programs (mostly PEUC and STC) | |
|---|---|---|---|
| 2020-01-04 | 2,245,684 | 0 | 32,520 |
| 2020-01-11 | 2,137,910 | 0 | 33,882 |
| 2020-01-18 | 2,075,857 | 0 | 32,625 |
| 2020-01-25 | 2,148,764 | 0 | 35,828 |
| 2020-02-01 | 2,084,204 | 0 | 33,884 |
| 2020-02-08 | 2,095,001 | 0 | 35,605 |
| 2020-02-15 | 2,057,774 | 0 | 34,683 |
| 2020-02-22 | 2,101,301 | 0 | 35,440 |
| 2020-02-29 | 2,054,129 | 0 | 33,053 |
| 2020-03-07 | 1,973,560 | 0 | 32,803 |
| 2020-03-14 | 2,071,070 | 0 | 34,149 |
| 2020-03-21 | 3,410,969 | 0 | 36,758 |
| 2020-03-28 | 8,158,043 | 0 | 48,963 |
| 2020-04-04 | 12,444,309 | 0 | 64,201 |
| 2020-04-11 | 16,249,334 | 136,417 | 117,331 |
| 2020-04-18 | 17,756,054 | 994,850 | 168,467 |
| 2020-04-25 | 21,723,230 | 3,402,409 | 237,569 |
| 2020-05-02 | 20,823,141 | 6,102,381 | 338,016 |
| 2020-05-09 | 22,725,217 | 7,793,066 | 438,839 |
| 2020-05-16 | 18,788,626 | 10,740,918 | 435,871 |
| 2020-05-23 | 19,022,578 | 9,715,948 | 766,537 |
| 2020-05-30 | 18,548,442 | 9,374,248 | 1,336,818 |
| 2020-06-06 | 18,330,151 | 11,046,401 | 1,177,265 |
| 2020-06-13 | 17,552,371 | 12,853,484 | 1,105,692 |
| 2020-06-20 | 17,316,689 | 14,363,143 | 1,242,503 |
| 2020-06-27 | 16,410,059 | 14,282,999 | 1,310,272 |
| 2020-07-04 | 17,188,772 | 13,179,880 | 1,434,063 |
Notes: Pandemic Unemployment Assistance (PUA) is the federal program for workers who are out of work because of the virus but who are not eligible for regular state unemployment insurance benefits (e.g. the self-employed). "Other programs" includes PEUC, STC, and others; a full list can be found in the bottom panel of the table on page 4 at this link https://www.dol.gov/ui/data.pdf.
Source: U.S. Employment and Training Administration, Initial Claims [ICSA], retrieved from Department of Labor (DOL), https://oui.doleta.gov/unemploy/docs/persons.xls and https://www.dol.gov/ui/data.pdf, July 23, 2020.
Enjoyed this post?
Sign up for EPI's newsletter so you never miss our research and insights on ways to make the economy work better for everyone.