Timing matters: Can job polarization explain wage trends?
This post is the second in a short series that assesses the role of technological change and job polarization in wage inequality trends.
The recently posted introduction of Assessing the job polarization explanation of growing wage inequality, a paper I wrote with Heidi Shierholz and John Schmitt, has started to raise some interest in the topic so it’s worth surfacing some of the issues and evidence it contains. John has already written a blog post on the fact that job polarization (the expansion of low and high-wage occupations and the shrinkage of middle-wage occupations) did not occur in the 2000s and that recent occupational employment shifts are clearly not driving recent wage trends. Our paper raises two sets of empirical issues. First, we point out that the evidence that job polarization caused wage polarization (growing inequality in the top half of the wage distribution but stable or shrinking inequality in the bottom half) in the 1990s is entirely circumstantial, relying on the two trends (employment and wage polarization) occurring at the same time without demonstration of any linkage. Second, the paper challenges whether occupational employment trends drive key wage patterns.
This post explores the point that one piece of missing evidence from the “job polarization is causing wage inequality” story is around the timing of employment and wage changes. That is, all of the evidence presented so far on job polarization relates to wage and employment trends over big chunks of time (1979–89 and 1989–99 or even 1974–88 and 1988–2008) and there has not been an examination of year-by-year trends. This is important because the key wage pattern that job polarization is intended to explain—changes in the wage inequality in the bottom half (the 50/10 wage gap) between the 1980s and 1990s—happened fairly abruptly in a few short years.
MORE FROM THE SERIES
JOHN SCHMITT: Job polarization in the 2000s?
LARRY MISHEL: Occupation employment trends and wage inequality
HEIDI SHIERHOLZ: Are the job polarization data robust?
Daron Acemoglu and David Autor, in an important 2012 paper, are clear about the main issue involved, which they motivate by showing the wage trends among men in the following chart.

They note:
“This pattern is seen in Figure 4, which plots changes in hourly wages relative to the change at the median by earnings percentile among male workers between 1974 and 2008. We divide the sample into two time intervals that roughly capture the changing dynamics of earnings inequality. During the initial period of 1974 through 1988, the monotonicity of wage changes by percentile is evident. Equally visible is the U-shaped (or ‘polarized’) growth of wages by percentile in the 1988 through 2008 period. Interestingly, the steep gradient of wage changes above the median is nearly parallel for these two time intervals. Thus, the key difference between these periods turns on the evolution of the lower tail, which fell steeply in the 1980s and then regained ground relative to the median thereafter.” [Emphasis added, Acemoglu and Autor 2012, page 15]
Another way of expressing this is that the 50/10 wage gap (the gap between median, 50th percentile, hourly wage and low hourly wages, the 10th percentile) grew strongly in the 1980s and contracted in the 1990s. Acemoglu and Autor’s figure demonstrate this for male wages but the divergence in trends was even larger among women, for whom the 50/10 wage gap grew more strongly in the 1980s.
The following figure (based on Current Population Survey ORG data) shows, for all workers, the annual trend in the 50/10 wage gap and the shares of middle-wage and low-wage occupations in total employment that Acemoglu and Autor use to explain the 50/10 wage gap. The 50/10 wage gap expanded sharply in the 1980s through 1987 and then contracted in the 1990s and stabilized in the 2000s. Employment in middle-wage occupations declined at a steady pace over the entire period. In contrast, the employment share in low-wage (i.e., service) occupations was stable and remained at a low level—roughly 15 percent of total employment. More specifically, the low-wage occupation employment share was stable over the 1980s and 1990s, expanding by 0.1 percentage points in the 1979–89 period and falling by 0.1 percentage points from 1989 to 2000 (Acemoglu and Autor’s analysis of decennial Census data shows low-wage occupations’ share of total employment expanding by 0.3 over 1979–89 and by 1.1 over 1989–99. These are small changes. The same trends are evident in hours-weighted data).
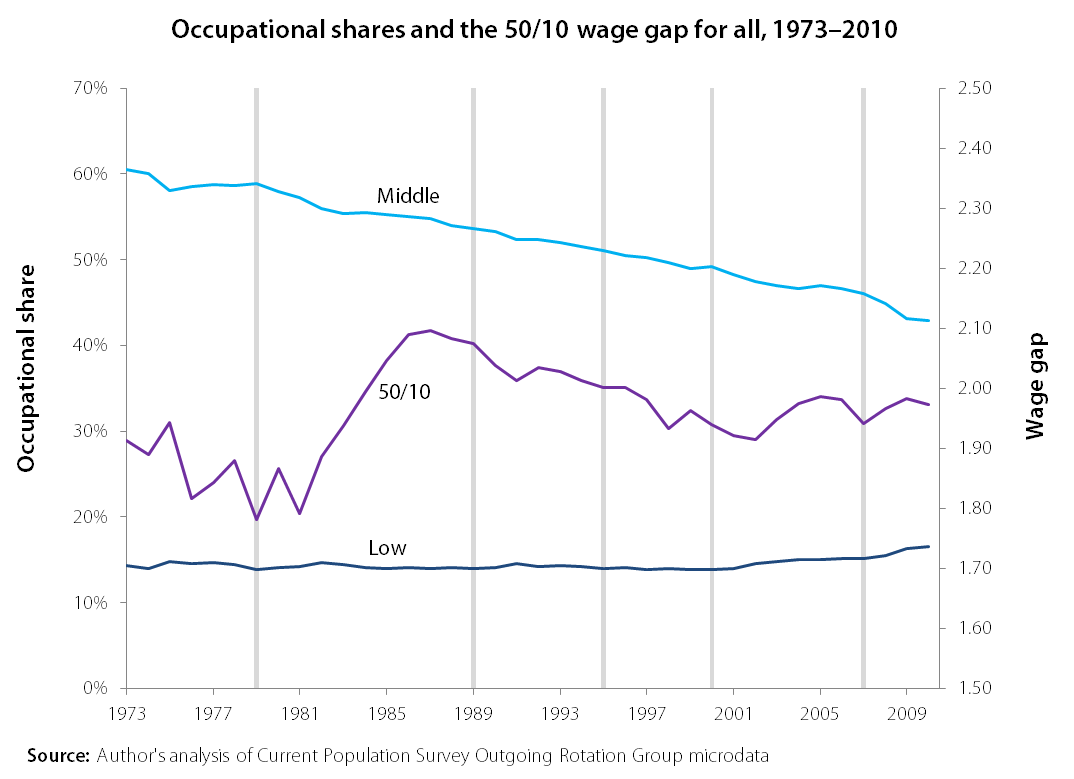
Here is the bottom line: Continuous trends in occupational employment shares cannot explain the discontinuous trend in the 50/10 wage gap, which expanded sharply in the 1980s and then contracted and stabilized thereafter. This timing issue is a serious flaw in using technologically-driven occupational employment trends to explain what Acemoglu and Autor properly call the “key difference” between the 1980s and 1990s wage trends.
A different explanation
A better candidate to explain the behavior of the 50/10 wage gap is the minimum wage, whose value dramatically eroded (to where it was hardly binding by 1987–88) over precisely the period that the 50/10 wage gap grew sharply and affected women far more so than men. In fact, the wage chapter of The State of Working America draws on the research of Autor and two co-authors to show that: (1) 66 percent of the 25.2 percentage-point (in logs) growth of the 50/10 wage gap among women from 1979 to 2009 can be explained by the change in the minimum wage; and, (2) 57 percent of the 11.4 percentage-point (in logs) growth of the 50/10 wage gap from 1979 to 2009 among all workers can be explained by the minimum wage. Another key factor has been unemployment. State of Working America also updated some research by Alan Krueger and Lawrence Katz (from 1999), showing that high unemployment disproportionately hurts low-wage workers more than middle-wage workers and more so for men than women. In our view, unemployment is another key factor explaining trends in the 50/10 wage gap over the last three decades, especially the excessive unemployment in the early 1980s, which subsided by 1987-88, and the sharp drop in unemployment in the late 1990s.
Note: “Job polarization” is just the latest version of the technology story that has failed to be able to explain wage inequality trends in the bottom half. Here’s what was said 16 years ago:
“If technology were adverse for ”unskilled” or “less-educated” workers, then we would expect a continued expansion of the wage differential between middle-wage and low-wage workers (the 50/10 differential). Yet, the 50/10 differential has been stable or declining among both men and women since 1986 or 1987. Instead, we are seeing the top earners pulling away from nearly all other earners. Therefore, there seem to be factors driving a wedge between the top 10% and everyone else, rather than a single factor aiding the vast majority but leaving a small group of unskilled workers behind.” (Mishel, Bernstein and Schmitt, The State of Working America, 1996-97)
Enjoyed this post?
Sign up for EPI's newsletter so you never miss our research and insights on ways to make the economy work better for everyone.