This chart appears in:
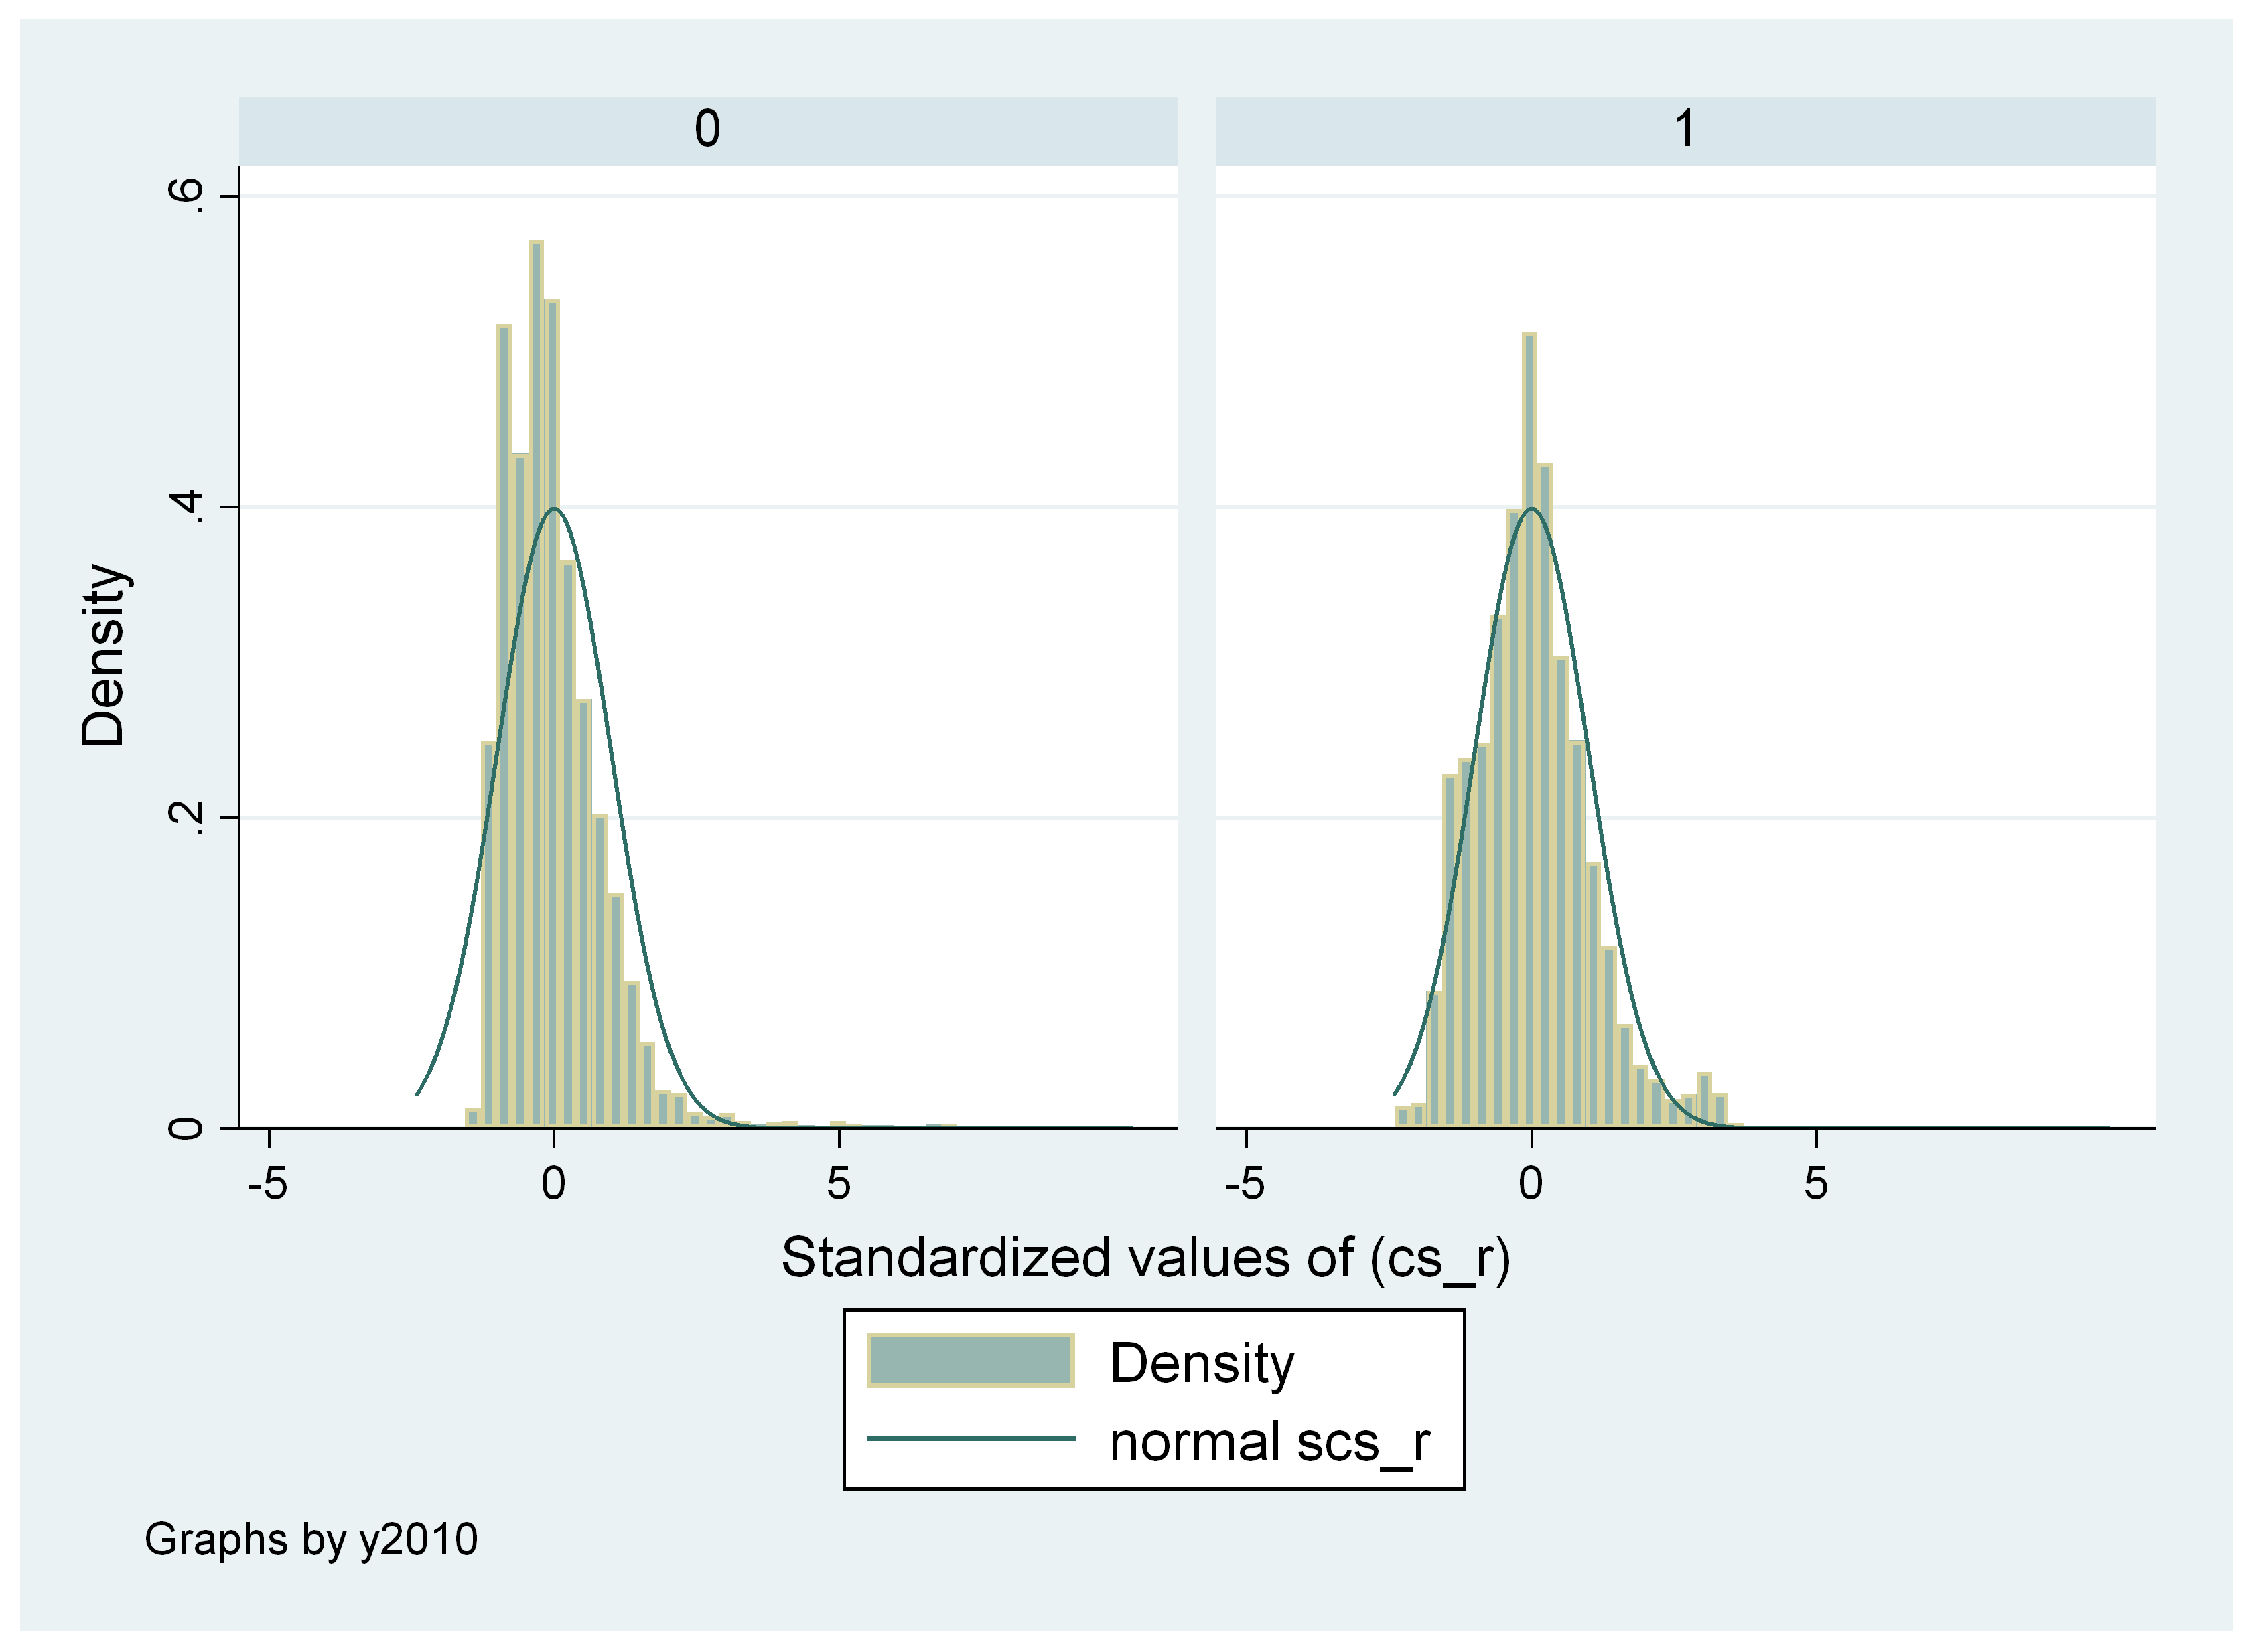
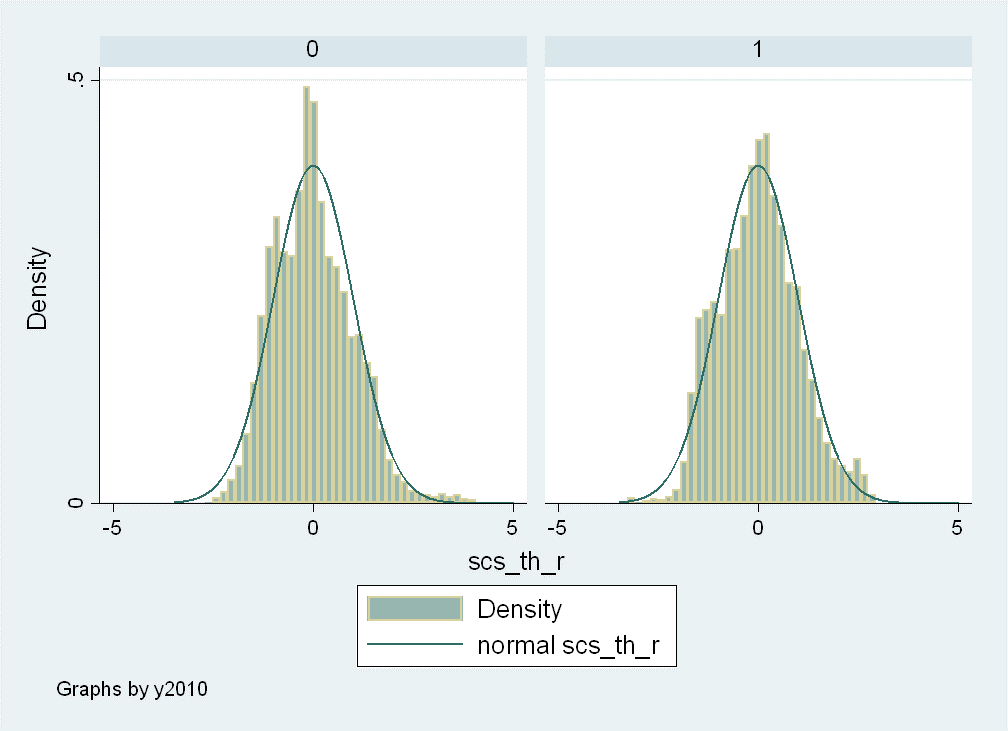
Previous chart: « Scale scores, 1998 (left) and 2010 (right)
Next chart: State unemployment rates, by race/ethnicity and overall, 2017Q2 »
This chart appears in:
Previous chart: « Scale scores, 1998 (left) and 2010 (right)
Next chart: State unemployment rates, by race/ethnicity and overall, 2017Q2 »