[THIS TESTIMONY WAS GIVEN BEFORE U.S. HOUSE OF REPRESENTATIVES’ SUBCOMMITTEE ON INCOME SECURITY AND FAMILY SUPPORT OF THE COMMITTEE ON WAYS AND MEANS ON APRIL 10, 2008.]
EPI’s statement on extending unemployment insurance
Good Morning Chairman McDermott, Ranking Member Weller, and distinguished members of the Subcommittee on Income Security and Family Support. My name is Heidi Shierholz and I am an economist who studies labor market issues at the Economic Policy Institute. I am delighted that you have chosen to hold a hearing on the urgent issue of extending unemployment insurance and I appreciate the opportunity to appear before you today to share my views.
The unemployment rate—at 5.1% in March—is not at an historically high level, but it is higher than average for the beginning of a recession. The unemployment rate at the start of the last ten recessions—going back 60 years—averaged 4.7%, including 4.3% at the start of the last recession in March 2001. The fact is that the unemployment rate is naturally a lagged indicator of an economic slowdown, exhibiting low levels at the beginning of a recession and sharp increases during a recession. In what follows I will present evidence on why the current unemployment rate should in no way preclude the immediate extension of unemployment insurance benefits. To the contrary, my analysis of historical and projected trends in long term unemployment, as well as a comparison of where relevant economic indicators are today compared to when Congress first extended benefits during the last recession, strongly indicate that an immediate extension is warranted.
Long Term Unemployment is Unusually High
Long term unemployment—defined here as the share of the unemployed who have been jobless for more than six months—is a crucial measure in this context because six months is the mark at which most workers exhaust their regular unemployment insurance benefits. Currently, long-term unemployment is unusually high given the unemployment rate. Figure 1 presents the unemployment rate and long-term unemployment over the last forty years. Two things pop out when looking at this plot: first, the two series follow a similar cyclical pattern, peaking after the end of each recession (recessions are shaded in the plot), and second, long term unemployment also follows a generally upward trend and is currently much higher relative to the unemployment rate than in the past. The fact that a much higher portion of the unemployed have been unemployed long-term shows that the unemployment rate alone is insufficient in capturing how difficult it is in today’s labor market for many people to find a job.
.jpg)
Historically, when the unemployment rate was near where it is now, long term unemployment averaged 10.5%. During the current business cycle, however, when the unemployment rate was near current levels, long term unemployment averaged 18.5%.1 Figure 2 shows the dramatic difference in long term unemployment in the current labor market compared to the historic average. Taken together, figures 1 and 2 show that a great many more workers are stuck in long-term joblessness than would be expected given the relatively low unemployment rate.
.jpg)
How Many More Long-Term Unemployed Can We Expect During the Current Economic Slowdown?
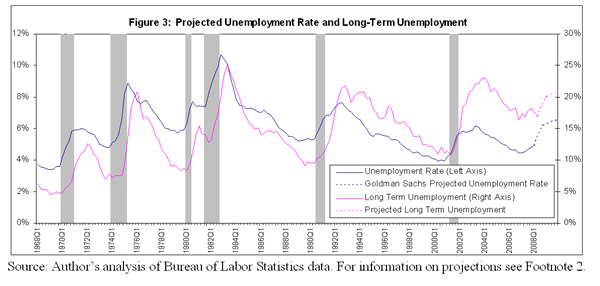
As mentioned above, unemployment rates are lagged indicators of an economic slowdown. With the March employment report showing job losses for the third straight month, we believe we have entered into a potentially severe economic downturn, and an important question to consider is how many workers are expected to experience long-term unemployment before the economy turns up again. To address this question, we used unemployment projections from Goldman Sachs, labor force projections from the Congressional Budget Office, and a simple statistical model to project long-term unemployment through the end of 2009.2 Figure 3 presents the projections. We project that by the end of 2009, 20.8% of the unemployed will be unemployed long-term. The number of long-term unemployed would be 1.4% of the total workforce, or 2.1 million workers—up 64% from the 1.3 million long-term unemployed today.
Highly Educated and Experienced Workers are Disproportionately Hard-Hit by Long-Term Unemployment
With so many workers either in or headed for long-term unemployment, the question arises—who are these workers? An analysis of microdata from the Current Population Survey, the same data used to calculate the official unemployment numbers, illustrates the characteristics of these workers. Table 1 presents shares of the total unemployed (column 1) and the long-term unemployed (column 2) by subgroup for January 2008, the latest date these data are available. Comparing these two columns shows which subgroups of jobless workers are over- and under-represented among the long-term unemployed. For example, while workers aged 45 and over make up 28.4% of the unemployed, they make up 36.7% of the long-term unemployed. In other words, these experienced workers are overrepresented among the long-term unemployed; if unemployed, workers aged 45 and over are unusually likely to be unemployed long-term. On the other hand, while workers aged 16-24 make up 32.0% of the unemployed, they make up only 24.8% of the long-term unemployed, meaning that young workers are underrepresented among the long-term unemployed. Education subgroups paint a similar picture: while only 13.5% of workers with a bachelor’s degree or more are unemployed, 16.3% are long-term unemployed, meaning that the most educated workers are overrepresented among the long-term unemployed. The reverse is true for less-educated workers, who are underrepresented among the long-term unemployed. When looking at the breakdowns by occupation, we find a similar story; white collar workers are overrepresented among the long-term unemployed, and blue collar workers are underrepresented. This table shows that even the most educated and experienced workers are not sheltered from the effects of the slowing economy on the labor market.
.jpg)
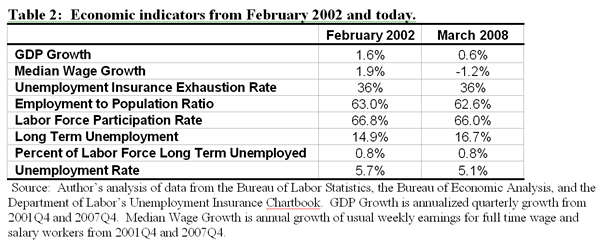
How Healthy is the Current Economy Compared to When Unemployment Insurance was First Extended During the Last Recession?
March 2002 was the first time unemployment insurance benefits were extended during the last recession. We end this testimony with a brief look at various economic indicators available when that decision was made (February 2002) compared to the same indicators today. These figures are presented in Table 2. What we find is that according to a host of key economic indicators, the economy is currently at least as bad off as it was in February 2002. Both GDP and med
ian real wages are now growing at a much slower rate than they were then—in fact median real wages declined 1.2% over the last year. Also, the Exhaustion Rate—the proportion of claimants who have exhausted all of their unemployment insurance entitlement—is the same now as it was then. Furthermore, a higher percent of the population was employed in February 2002 than now, a higher percent of the population was participating in the labor force, and a lower percent of the unemployed had been unemployed long-term. And crucially, the percent of the labor force that is long-term unemployed is the same today as it was when Congress extended unemployment insurance benefits during the last recession. These figures tell us that, despite the currently low unemployment rate relative to when extensions were first enacted during the last recession: 1) the economy is in at least as precarious a position as it was at that time, and 2) an immediate policy response is now warranted.
Conclusion
Despite the current relatively low unemployment rate, long term unemployment is already a problem that merits prompt action and it is only expected to get worse as the economic downturn deepens. For individuals seeking work in this economy, the search is likely to be long, putting an enormous strain on the families of the over two million workers projected to be long-term unemployed in the next 15 months. We strongly urge Congress to extend unemployment benefits immediately.
It is important to note that extending UI benefits would be effective on two fronts. First, it would support the families who have lost the most in the current economic slowdown, and second, it would provide an important and effective economic stimulus. The Congressional Budget Office has estimated that once up and running, a national UI extension would put more than one billion dollars per month in the hands of jobless workers and their families. Furthermore, Mark Zandi of Economy.com estimates that every dollar spent on unemployment insurance boosts the economy by $1.73.4 The effectiveness of the UI stimulus is due to the fact that the long-term unemployed, who are likely to have depleted their savings, tend to quickly spend essentially every dollar they receive on necessities found in their local economy. Thus, extending UI benefits would give the economy a more than 1.7 billion dollar boost per month at a time when it needs it the most. Immediately extending unemployment benefits is not only the right thing to do for the families of the long-term jobless in this demonstrably slow and slowing labor market, it is also very smart economic policy.
Thank you and I am more than happy to answer any questions you may have.
Footnotes
[1] The historic average includes data from 1948 up to (but not including) the current business cycle. An employment rate “near” where it is now means within a quarter of a percent.
[2] We regressed the long term unemployment rate on the unemployment rate and the unemployment rate lagged one quarter. All variables in the model were first-differenced. This produced an adequate model with white noise residuals and a good fit (DW: 1.62, R-sq: 0.64). We then forecasted the long term unemployment rate through 2009 using unemployment rate projections from Goldman Sachs. Finally, using the Goldman Sachs forecasts of the unemployment rate, our forecasts of the long term unemployment rate, and CBO forecasts of the labor force, we backed out long term unemployment both in levels and as a percent of the unemployed.
[3] White collar occupations are management, business, financial, professional, sales, office, administrative support, and related occupations. Blue collar occupations are farming, fishing, forestry, construction, extraction, installation, maintenance, repair, production, transportation, and material moving occupations.
[4] Congressional Budget Office, “Options for Responding to Short-Term Economic Weakness”, January 2008, and M. Zandi, “Assessing President Bush’s Fiscal Policies,” Economy.com, July 2004.
Heidi Shierholz is an economist at the Economic Policy Institute in Washington, D.C.
