January 31, 2007
Economy ends 2006 healthy
by EPI economist L. Josh Bivens
The Bureau of Economic Analysis (BEA) reported today that real gross domestic product (GDP) in the U.S. economy grew 3.5% in the fourth quarter of 2006, up from 2.0% in the previous quarter. Average annual growth for the 2006 calendar year was 3.4%, up slightly from 3.2% in 2005. In short, 2006 was a respectable year for GDP growth.
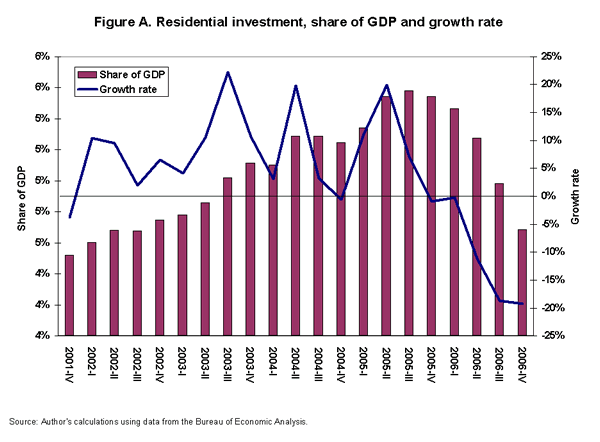
A large drag on growth in this quarter came again from the weak housing sector, with residential investment falling by over 19% and subtracting 1.2% off total GDP. Non-residential investment was essentially flat for the quarter. The housing sector and its persistent weakness continue to grow as macroeconomic concerns: both its growth rate and its share of total GDP have been in recent sharp decline (Figure A ).
The pronounced weakness in the housing sector was compensated for this quarter by very strong growth in personal consumption expenditures, which rose 4.4% in the quarter and contributed 3.1% to GDP. This strong consumption, however, also translated into a seventh consecutive quarter of negative personal savings (-1%).
National defense expenditures grew 12% and contributed 0.5% to overall growth; state and local government expenditures contributed another 0.4%.
The combination of strong export growth and import declines led to a large contribution to GDP (1.6%) from net exports. This strong growth in net exports contributed to one encouraging sign in this report: the substantial gap between growth in final sales (up 5.8%) and domestic demand (up 2.4%). The gap between the two essentially represents foreign demand for U.S. production, and an ongoing gap between these two is necessary for a benign unwinding of the large U.S. trade deficit (5% of GDP in this report, the lowest quarterly figure since 2003).
Additionally, continued growth in foreign demand for U.S. exports will have to play a key role in filling in the hole dug by falling residential investment and decelerating housing prices in the U.S. economy. The patterns of demand growth in this report are encouraging and are what the U.S. economy will need to see more of in coming quarters. However, it should be noted that these patterns have appeared in previous recent quarterly reports only to be reversed. Whether or not the U.S. economy is really headed toward a healthy “soft-landing” in unwinding its trade deficit and recovering from a deflation of the boom in the housing sector remains an open question. Continuing this healthy reorientation of demand will depend largely on whether the value of the dollar falls against a broader range of currencies (particularly those whose value is managed by governments) and allows better export performance in a wider range of global markets.
Inflation in core prices (the market-based deflator for personal consumption expenditures, minus food and energy) fell again in the fourth quarter, with prices rising 1.7% compared to 1.9% growth in the previous quarter. This marks the second straight decline in this key measure of inflation and provides further evidence that policy maneuvers aimed at tamping down price growth (interest rate hikes by the Federal Reserve, for example) should be a low priority at this time.
The fourth quarter of 2006 marks five years of the current economic recovery (which began in the fourth quarter of 2001). This seems like a good time to put this recovery in historical perspective. Figure B charts GDP growth in this recovery versus the early 1990s recovery and the average of the four other recoveries since World War II that have lasted this long. Figure B measures GDP growth from the previous business cycle peak (the first quarter of 2001, in the current case), as peak-to-peak comparisons of business cycles provide the fairest basis for comparison. The current recovery, for example, would look particularly bad if measured from the trough, as the 2001 recession was particularly mild in GDP terms, and growth did not benefit from a rapid “bounce-back” effect that characterized growth following particularly steep recessions (as in the early 1980s).
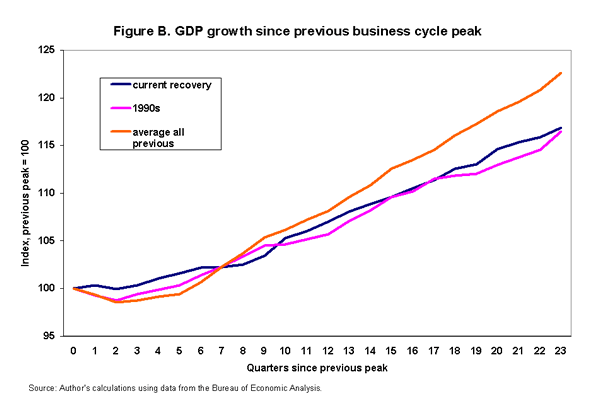
Figure B shows that the current recovery essentially mimics the 1990s experience, and both lag the historical average. It should, however, be noted that that productivity growth (GDP per hour worked) was rising at the similar point in the 1990s recovery, while it seems to be decelerating currently. In short, unless there is a turnaround in productivity growth, the current recovery will quickly begin lagging even the 1990s recovery in coming quarters.
To view archived editions of GDP PICTURE, click here.
The Economic Policy Institute GDP PICTURE is published quarterly upon release of the Bureau of Economic Analysis’ quarterly GDP report.
EPI offers same-day analysis of income, price, employment, and other economic data released by U.S. government agencies. For more information, contact EPI at 202-775-8810.