Remarks by Josh Bivens on why it is too soon for the Fed to slow the economy
On Wednesday, December 16, the Federal Reserve is expected to announce that it is raising interest rates above zero for the first time in seven years. In recent briefings and presentations, EPI Research and Policy Director Josh Bivens has argued that a rate increase would be a mistake. The following is a rough transcript of remarks delivered at events including a December 1 briefing with Rep. John Conyers.
It’s a near lock that the Fed will raise the short-term interest rates it controls off of zero this week—where they’ve been sitting since the end of 2008. I think this is a mistake. You should raise interest rates only when you think you need to start slowing the pace of economic growth because you’re worried that fast growth and falling unemployment will spark too-rapid wage growth that will bleed into rapid price inflation. But there’s no reason to think that the pace of economic growth today is excessive and needs to be slowed because of incipient inflation.1
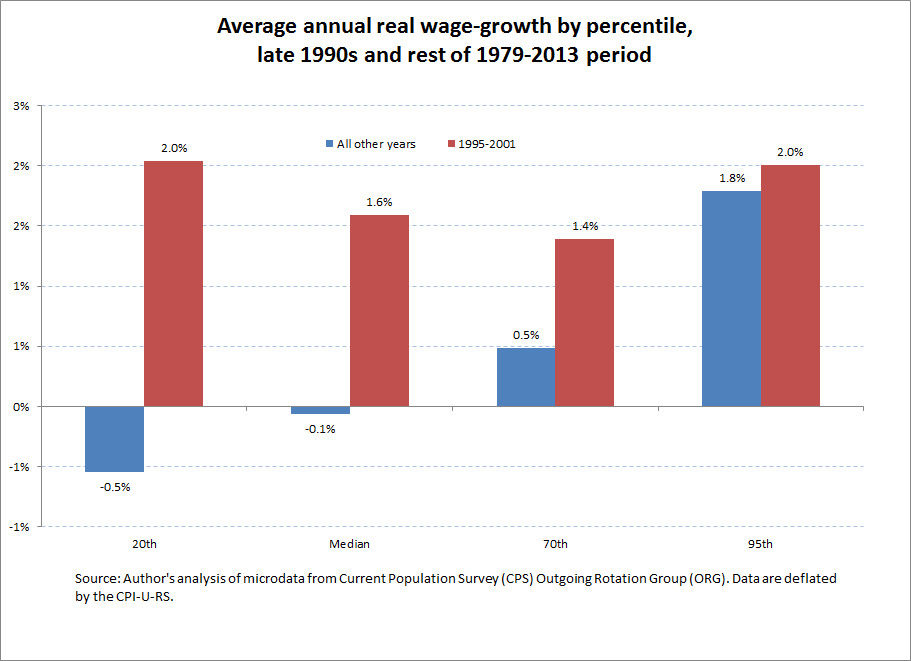
And the stakes to getting this tradeoff between low unemployment and stable inflation wrong are huge. Since 1979, the bottom 70 percent of American workers have essentially seen one multi-year episode of strong, equitable growth in hourly pay. That occurred in the late 1990s and early 2000s, when unemployment fell far below what existing estimates said it could without sparking inflation—it bottomed out at 3.8 percent for a month in 2000, and averaged 4.1 percent for two solid years in 1999 and 2000. This led to the only serious period of strong, equitable wage growth in the past 35 years. The bottom 70 percent saw trivial wage growth (or wage declines) in the entire rest of that period. The figure below shows wage growth in the late 1990s/early 2000s compared to the rest of the 1979-2013 period for various points in the wage distribution. Besides the top 5 percent, it can be seen that most wages grew much faster during the late 1990s high-pressure labor markets than in other periods post-1979.
So, what’s behind the thinking that it’s time to start reining in the pace of economic growth and stop the downward progress on unemployment? Essentially, it’s the idea that low rates of unemployment will begin giving workers too much bargaining power vis-à-vis their employers, and that they will be able to demand large wage increases. These wage increases will in turn feed into increases in prices as the rise in labor costs are passed on to consumers. And this will increase price inflation.
Is this totally crazy? Not really—it is definitely the case that workers have more bargaining power when unemployment is low than when it is high. This is not something only Fed economists believe—even Marx thought it was true (the reserve army of labor and all of that).
But it’s a long way from acknowledging this fact that lower unemployment will eventually boost wage growth to saying that it’s time for the Fed to begin raising rates. In fact, right now, lower unemployment that boosted wage and price growth would be an affirmatively good thing. Wages and prices are clearly growing too slowly.
The pressure to raise rates now, even in the face of a complete absence of inflationary pressures in the data, reflects a couple of strands of conventional thinking that are deeply damaging to prospect of workers’ wages rising anytime in the near future.
The first strand of this conventional thinking is that the threshold rate of unemployment below which the wage-price pressure begins is known beforehand. In the jargon, that the NAIRU (or the Non-Accelerating Inflation Rate of Unemployment, a terribly undescriptive and even misleading label) is well-estimated ex ante. The idea is essentially that “we’ve run the model and the magical number is X.X.” Keep unemployment above that or else.
The second strand is that breaching this threshold by even a bit doesn’t just mean that wage growth and price growth increase, but that they accelerate without end.
On the first strand—is there an unemployment rate low enough to spur an uptick in wage growth? Sure. What is it? I don’t know and neither does the Fed. Less than a year ago, the Fed thought it was 5.4 percent. Then we got there and wage growth didn’t budge so they (quite sensibly) said, ok, must be lower. Now they think it’s 5.0 percent.
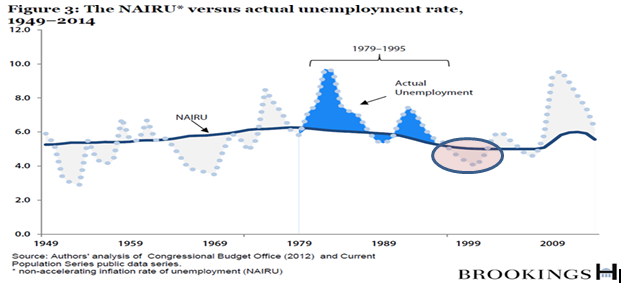
In the mid-1990s the strong consensus among macroeconomists was that the NAIRU was at least 5.5, maybe even 6 percent. Back then it was thought for sure that letting the unemployment rate fall below this level would inevitably cause accelerating inflation. Dissidents to this view were mocked. Then we averaged 4.1 percent unemployment for 2 full years (it bottomed out at the unreal-sounding 3.8 percent—look at the chart below and particularly note the late 1990s period where the actual rate dips below the estimated NAIRU) and the U.S. economy got no accelerating inflation but did get excellent, broad-based wage growth. This episode should tell us that we really need the Fed to be aggressive and experiment with just how low the unemployment rate can go.
On the second strand—will inflation will not just rise but continually accelerate should we ever drift below the NAIRU? This is far from clear.
Say that we allowed unemployment to get to 4.5 percent and wage growth actually got fast enough to push inflation up to 2 percent. Now say we decided to let the economy keep running hot and unemployment got to 4 percent, while wage costs rose even further and pushed price inflation to 3 percent. Would this really be a problem? It’s hard to see why. And as I’ll note below, some wage and price inflation overshooting is not just not a problem, but will be a necessary part of economic normalization.
But the accelerationist view is that “oh, at 4 percent unemployment, it wouldn’t stop there—even if unemployment got no lower than 4 percent, just keeping it there for a while would lead to inflation the next year of 4 percent, then 6 percent, then 8 percent, and…” Even I (a pretty avowed inflation dove in the world of macroeconomists) would say “yeah, that’s really not very useful.”
How does this kind of wage-price spiral happen?
Basically, it says that at exactly full employment, workers target real wage growth (that is, wages adjusted for inflation) equal to productivity growth, and they get it. Further, they’re able to adjust their nominal wage demands by exactly the amount that inflation increased last year to keep their real wage on target.
When unemployment is above the NAIRU, workers target real wage growth that is less than productivity—their wage aspirations and/or ability to get them are hamstrung by high unemployment. Makes sense.
But, if the unemployment rate dips below the NAIRU, then workers overreach and shoot for real wage increases that are greater than productivity growth. They of course can’t get them—productivity is the ceiling on what the economy can deliver.2 But, because the way you shoot for a real wage increase is to make a nominal wage demand, their demands set off wage-price spirals. Workers get their nominal raises, but then employers raise prices and that erodes real wages, workers (still overreaching and trying to get those unattainable real wage increases) just ratchet UP their nominal wage demands, and so on.
From here, the only way to break the wage-price spiral is to have policymakers slow the economy to raise unemployment and start sapping workers’ bargaining power so they make more moderate wage demands.
In the current context, the argument for tightening is that we’re getting really close to the NAIRU threshold, and, this means that we’re in danger of setting off this wage-price spiral. Is this realistic? Not particularly.
For one, wage-price spirals have to start somewhere—and it’s usually with some evidence that wages are beginning to accelerate. So far throughout this recovery, that evidence is not there at all. We’ve had steady 2-2.3 percent nominal wage growth since the recovery began. And people keep trying to find wage pressure in various indicators, and you get 3-6 month periods where it looks like maybe they’re about to break out of this 2-2.3 percent range, but then they fall back. Irresistible upward momentum just doesn’t look to be a function of the data.
Just how bad is nominal wage growth of less than 2.5 percent? Pretty terrible, actually. If the Fed is trying to hit a 2 percent price inflation target, then nominal wages should be growing at 2 percent plus the trend rate of productivity growth in a healthy economy. So, a healthy economy should be generating nominal wage growth of roughly 3.5 percent. But of course wage growth has not been anywhere near this target since the Great Recession began.
Nominal wage growth has been far below target in the recovery: Year-over-year change in private-sector nominal average hourly earnings, 2007-2016
| All nonfarm employees | Production/nonsupervisory workers | |
|---|---|---|
| Mar-2007 | 3.59% | 4.11% |
| Apr-2007 | 3.27% | 3.85% |
| May-2007 | 3.73% | 4.14% |
| Jun-2007 | 3.81% | 4.13% |
| Jul-2007 | 3.45% | 4.05% |
| Aug-2007 | 3.49% | 4.04% |
| Sep-2007 | 3.28% | 4.15% |
| Oct-2007 | 3.28% | 3.78% |
| Nov-2007 | 3.27% | 3.89% |
| Dec-2007 | 3.16% | 3.81% |
| Jan-2008 | 3.11% | 3.86% |
| Feb-2008 | 3.09% | 3.73% |
| Mar-2008 | 3.08% | 3.77% |
| Apr-2008 | 2.88% | 3.70% |
| May-2008 | 3.02% | 3.69% |
| Jun-2008 | 2.67% | 3.62% |
| Jul-2008 | 3.00% | 3.72% |
| Aug-2008 | 3.33% | 3.83% |
| Sep-2008 | 3.23% | 3.64% |
| Oct-2008 | 3.32% | 3.92% |
| Nov-2008 | 3.64% | 3.85% |
| Dec-2008 | 3.58% | 3.84% |
| Jan-2009 | 3.58% | 3.72% |
| Feb-2009 | 3.24% | 3.65% |
| Mar-2009 | 3.13% | 3.53% |
| Apr-2009 | 3.22% | 3.29% |
| May-2009 | 2.84% | 3.06% |
| Jun-2009 | 2.78% | 2.94% |
| Jul-2009 | 2.59% | 2.71% |
| Aug-2009 | 2.39% | 2.64% |
| Sep-2009 | 2.34% | 2.75% |
| Oct-2009 | 2.34% | 2.63% |
| Nov-2009 | 2.05% | 2.67% |
| Dec-2009 | 1.82% | 2.50% |
| Jan-2010 | 1.95% | 2.61% |
| Feb-2010 | 2.00% | 2.49% |
| Mar-2010 | 1.77% | 2.27% |
| Apr-2010 | 1.81% | 2.43% |
| May-2010 | 1.94% | 2.59% |
| Jun-2010 | 1.71% | 2.53% |
| Jul-2010 | 1.85% | 2.47% |
| Aug-2010 | 1.75% | 2.41% |
| Sep-2010 | 1.84% | 2.30% |
| Oct-2010 | 1.88% | 2.51% |
| Nov-2010 | 1.65% | 2.23% |
| Dec-2010 | 1.74% | 2.07% |
| Jan-2011 | 1.92% | 2.17% |
| Feb-2011 | 1.87% | 2.12% |
| Mar-2011 | 1.87% | 2.06% |
| Apr-2011 | 1.91% | 2.11% |
| May-2011 | 2.00% | 2.16% |
| Jun-2011 | 2.13% | 2.00% |
| Jul-2011 | 2.26% | 2.31% |
| Aug-2011 | 1.90% | 1.99% |
| Sep-2011 | 1.94% | 1.93% |
| Oct-2011 | 2.11% | 1.77% |
| Nov-2011 | 2.02% | 1.77% |
| Dec-2011 | 1.98% | 1.77% |
| Jan-2012 | 1.75% | 1.40% |
| Feb-2012 | 1.88% | 1.45% |
| Mar-2012 | 2.10% | 1.76% |
| Apr-2012 | 2.01% | 1.76% |
| May-2012 | 1.83% | 1.39% |
| Jun-2012 | 1.95% | 1.54% |
| Jul-2012 | 1.77% | 1.33% |
| Aug-2012 | 1.82% | 1.33% |
| Sep-2012 | 1.99% | 1.44% |
| Oct-2012 | 1.51% | 1.28% |
| Nov-2012 | 1.90% | 1.43% |
| Dec-2012 | 2.20% | 1.74% |
| Jan-2013 | 2.15% | 1.89% |
| Feb-2013 | 2.10% | 2.04% |
| Mar-2013 | 1.93% | 1.88% |
| Apr-2013 | 2.01% | 1.73% |
| May-2013 | 2.01% | 1.88% |
| Jun-2013 | 2.13% | 2.03% |
| Jul-2013 | 1.91% | 1.92% |
| Aug-2013 | 2.26% | 2.18% |
| Sep-2013 | 2.04% | 2.17% |
| Oct-2013 | 2.25% | 2.27% |
| Nov-2013 | 2.24% | 2.32% |
| Dec-2013 | 1.90% | 2.16% |
| Jan-2014 | 1.94% | 2.31% |
| Feb-2014 | 2.14% | 2.45% |
| Mar-2014 | 2.18% | 2.40% |
| Apr-2014 | 1.97% | 2.40% |
| May-2014 | 2.13% | 2.44% |
| Jun-2014 | 2.04% | 2.34% |
| Jul-2014 | 2.09% | 2.43% |
| Aug-2014 | 2.21% | 2.48% |
| Sep-2014 | 2.04% | 2.27% |
| Oct-2014 | 2.03% | 2.27% |
| Nov-2014 | 2.11% | 2.26% |
| Dec-2014 | 1.82% | 1.87% |
| Jan-2015 | 2.23% | 2.01% |
| Feb-2015 | 2.06% | 1.71% |
| Mar-2015 | 2.18% | 1.90% |
| Apr-2015 | 2.34% | 2.00% |
| May-2015 | 2.34% | 2.14% |
| Jun-2015 | 2.04% | 1.99% |
| Jul-2015 | 2.29% | 2.04% |
| Aug-2015 | 2.32% | 2.08% |
| Sep-2015 | 2.40% | 2.13% |
| Oct-2015 | 2.52% | 2.36% |
| Nov-2015 | 2.39% | 2.21% |
| Dec-2015 | 2.60% | 2.61% |
| Jan-2016 | 2.50% | 2.50% |
| Feb-2016 | 2.38% | 2.50% |
| Mar-2016 | 2.33% | 2.44% |
| Apr-2016 | 2.49% | 2.53% |
| May-2016 | 2.48% | 2.33% |
| Jun-2016 | 2.64% | 2.48% |
| Jul-2016 | 2.72% | 2.57% |
| Aug-2016 | 2.43% | 2.46% |
| Sep-2016 | 2.59% | 2.65% |
*Nominal wage growth consistent with the Federal Reserve Board's 2 percent inflation target, 1.5 percent productivity growth, and a stable labor share of income.
Source: EPI analysis of Bureau of Labor Statistics Current Employment Statistics public data series
This wage weakness—nominal growth of 2-2.5 percent instead of a more reasonable 3.5 percent—is by far the biggest reason why price inflation remains far below the Fed’s 2 percent long-run target, and is why we have actually gotten further and further away from the target in recent years.
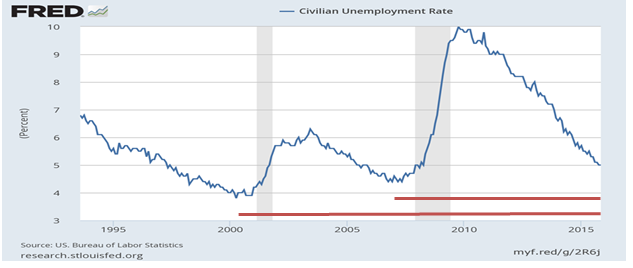
How can nominal wage growth remain so flat even though we’ve made big progress in reducing unemployment? Well, the progress has been mostly real and today’s labor market is obviously in much better shape than the labor market of 2010 or even 2012 or even 2014. But as the figure below shows, we are still non-trivially above the peak unemployment rate reached in the pre Great Recession economic expansion. And we’re significantly above the unemployment bottom of the genuinely full-employment late 1990s.
Further, indicators of labor market slack outside of the unemployment rate still tell a much-less impressive story about how close to full recovery we are. The prime-age (25-54 year old) employment to population ratio (EPOP), for example, has only recovered a bit less than half of the fall it took as the economy hit the Great Recession.
Employment-to-population ratio of workers ages 25–54, 2006–2015
| Month | Employment-to-population ratio |
|---|---|
| 2006-01-01 | 79.6% |
| 2006-02-01 | 79.7% |
| 2006-03-01 | 79.8% |
| 2006-04-01 | 79.6% |
| 2006-05-01 | 79.7% |
| 2006-06-01 | 79.8% |
| 2006-07-01 | 79.8% |
| 2006-08-01 | 79.8% |
| 2006-09-01 | 79.9% |
| 2006-10-01 | 80.1% |
| 2006-11-01 | 80.0% |
| 2006-12-01 | 80.1% |
| 2007-01-01 | 80.3% |
| 2007-02-01 | 80.1% |
| 2007-03-01 | 80.2% |
| 2007-04-01 | 80.0% |
| 2007-05-01 | 80.0% |
| 2007-06-01 | 79.9% |
| 2007-07-01 | 79.8% |
| 2007-08-01 | 79.8% |
| 2007-09-01 | 79.7% |
| 2007-10-01 | 79.6% |
| 2007-11-01 | 79.7% |
| 2007-12-01 | 79.7% |
| 2008-01-01 | 80.0% |
| 2008-02-01 | 79.9% |
| 2008-03-01 | 79.8% |
| 2008-04-01 | 79.6% |
| 2008-05-01 | 79.5% |
| 2008-06-01 | 79.4% |
| 2008-07-01 | 79.2% |
| 2008-08-01 | 78.8% |
| 2008-09-01 | 78.8% |
| 2008-10-01 | 78.4% |
| 2008-11-01 | 78.1% |
| 2008-12-01 | 77.6% |
| 2009-01-01 | 77.0% |
| 2009-02-01 | 76.7% |
| 2009-03-01 | 76.2% |
| 2009-04-01 | 76.2% |
| 2009-05-01 | 75.9% |
| 2009-06-01 | 75.9% |
| 2009-07-01 | 75.8% |
| 2009-08-01 | 75.6% |
| 2009-09-01 | 75.1% |
| 2009-10-01 | 75.0% |
| 2009-11-01 | 75.2% |
| 2009-12-01 | 74.8% |
| 2010-01-01 | 75.1% |
| 2010-02-01 | 75.1% |
| 2010-03-01 | 75.1% |
| 2010-04-01 | 75.4% |
| 2010-05-01 | 75.1% |
| 2010-06-01 | 75.2% |
| 2010-07-01 | 75.1% |
| 2010-08-01 | 75.0% |
| 2010-09-01 | 75.1% |
| 2010-10-01 | 75.0% |
| 2010-11-01 | 74.8% |
| 2010-12-01 | 75.0% |
| 2011-01-01 | 75.2% |
| 2011-02-01 | 75.1% |
| 2011-03-01 | 75.3% |
| 2011-04-01 | 75.1% |
| 2011-05-01 | 75.2% |
| 2011-06-01 | 75.0% |
| 2011-07-01 | 75.0% |
| 2011-08-01 | 75.1% |
| 2011-09-01 | 74.9% |
| 2011-10-01 | 74.9% |
| 2011-11-01 | 75.3% |
| 2011-12-01 | 75.4% |
| 2012-01-01 | 75.6% |
| 2012-02-01 | 75.6% |
| 2012-03-01 | 75.7% |
| 2012-04-01 | 75.7% |
| 2012-05-01 | 75.7% |
| 2012-06-01 | 75.7% |
| 2012-07-01 | 75.6% |
| 2012-08-01 | 75.7% |
| 2012-09-01 | 75.9% |
| 2012-10-01 | 76.0% |
| 2012-11-01 | 75.8% |
| 2012-12-01 | 75.9% |
| 2013-01-01 | 75.7% |
| 2013-02-01 | 75.9% |
| 2013-03-01 | 75.9% |
| 2013-04-01 | 75.9% |
| 2013-05-01 | 76.0% |
| 2013-06-01 | 75.9% |
| 2013-07-01 | 76.0% |
| 2013-08-01 | 75.9% |
| 2013-09-01 | 75.9% |
| 2013-10-01 | 75.5% |
| 2013-11-01 | 76.0% |
| 2013-12-01 | 76.1% |
| 2014-01-01 | 76.5% |
| 2014-02-01 | 76.5% |
| 2014-03-01 | 76.6% |
| 2014-04-01 | 76.5% |
| 2014-05-01 | 76.4% |
| 2014-06-01 | 76.8% |
| 2014-07-01 | 76.6% |
| 2014-08-01 | 76.8% |
| 2014-09-01 | 76.8% |
| 2014-10-01 | 76.9% |
| 2014-11-01 | 76.9% |
| 2014-12-01 | 77.0% |
| 2015-01-01 | 77.2% |
| 2015-02-01 | 77.3% |
| 2015-03-01 | 77.2% |
| 2015-04-01 | 77.2% |
| 2015-05-01 | 77.2% |
Source: EPI analysis of Bureau of Labor Statistics' Current Population Survey public data
Here, the argument often gets made that yes, we’re not at full employment today, but monetary policy decisions that are made today hit the economy in a year, so they have to guess ahead of time. And if you stay too aggressive for too long, then you make next year’s inflation really leap out of the bottle.
But this is really unconvincing. And the dangers of overshooting in that lag time are minimal. And in fact overshooting is not a problem to be avoided, it’s a necessary part of economic normalization.
What makes me say all of this? A number of things.
First, the history of wages over the past three decades. The vast majority of workers have not seen their real wages rise at the rate of economy-wide productivity growth in recent decades. In fact, the vast majority have seen wages barely budge at all in the last 35 years outside of the late 1990s episode we noted below.
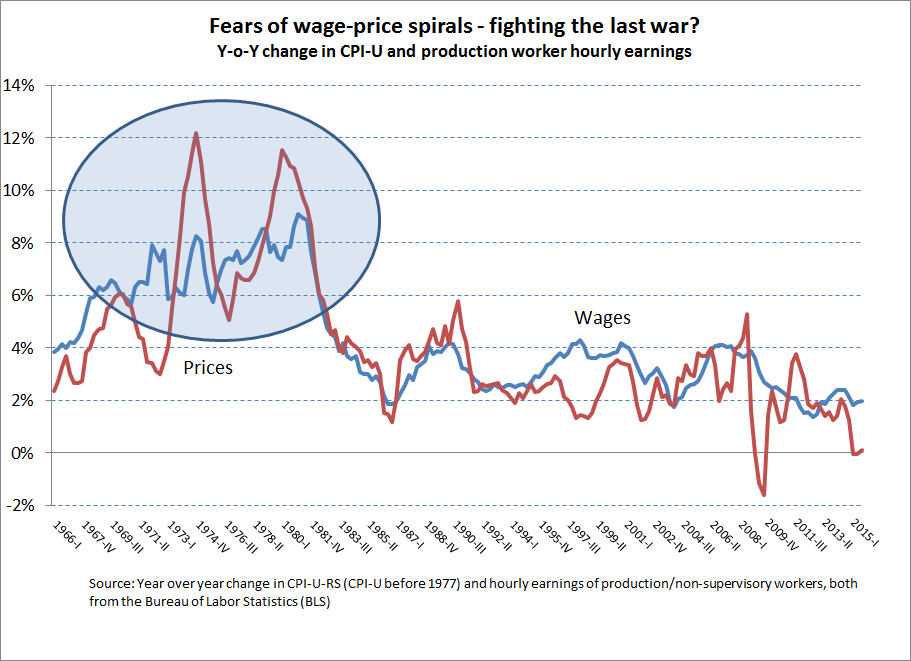
And, the evidence is that wages have largely not been putting upward pressure on prices over this period. In fact, price inflation has steadily declined over this time period, as you can see in the figure below.
So the evidence that wages are always looking for a chance to leap forward and spark a wage-price spiral is really thin. The real problem in managing the U.S. economy is not actually “how to keep wages from always trying to rise so fast,” instead, it’s “how do we make wages rise at all?”
Further, let’s say that I’m wrong and the economy really is just on the cusp of unleashing a big increase in the pace of wage-growth that will shove us well above our 3.5 percent healthy-economy target. Is this a fearsome risk? Not at all. It’s a necessary part of economic normalization. Essentially, we need wage growth of more than 3.5 percent for a stretch to allow workers to reclaim some of the huge losses in the share of total income that goes to them rather than capital owners since the Great Recession began (see the figure below on the share of corporate sector income claimed by workers rather than capital owners).
Workers' share of corporate income hasn't recovered: Share of corporate-sector income received by workers over recent business cycles, 1979–2016
| Labor Share | |
|---|---|
| Jan-1979 | 79.0% |
| Apr-1979 | 79.5% |
| Jul-1979 | 80.2% |
| Oct-1979 | 80.8% |
| Jan-1980 | 81.2% |
| Apr-1980 | 82.7% |
| Jul-1980 | 81.9% |
| Oct-1980 | 80.6% |
| Jan-1981 | 80.3% |
| Apr-1981 | 80.4% |
| Jul-1981 | 79.6% |
| Oct-1981 | 80.5% |
| Jan-1982 | 81.6% |
| Apr-1982 | 81.0% |
| Jul-1982 | 81.0% |
| Oct-1982 | 81.4% |
| Jan-1983 | 81.0% |
| Apr-1983 | 79.9% |
| Jul-1983 | 79.4% |
| Oct-1983 | 79.1% |
| Jan-1984 | 77.8% |
| Apr-1984 | 78.0% |
| Jul-1984 | 78.5% |
| Oct-1984 | 78.3% |
| Jan-1985 | 78.4% |
| Apr-1985 | 78.6% |
| Jul-1985 | 78.2% |
| Oct-1985 | 79.6% |
| Jan-1986 | 79.9% |
| Apr-1986 | 80.8% |
| Jul-1986 | 81.5% |
| Oct-1986 | 81.8% |
| Jan-1987 | 81.7% |
| Apr-1987 | 80.9% |
| Jul-1987 | 80.4% |
| Oct-1987 | 80.9% |
| Jan-1988 | 80.9% |
| Apr-1988 | 80.9% |
| Jul-1988 | 80.8% |
| Oct-1988 | 80.2% |
| Jan-1989 | 80.6% |
| Apr-1989 | 80.9% |
| Jul-1989 | 80.9% |
| Oct-1989 | 81.9% |
| Jan-1990 | 81.8% |
| Apr-1990 | 81.6% |
| Jul-1990 | 82.7% |
| Oct-1990 | 83.1% |
| Jan-1991 | 82.2% |
| Apr-1991 | 82.5% |
| Jul-1991 | 82.8% |
| Oct-1991 | 83.3% |
| Jan-1992 | 83.0% |
| Apr-1992 | 83.1% |
| Jul-1992 | 83.6% |
| Oct-1992 | 83.0% |
| Jan-1993 | 83.5% |
| Apr-1993 | 82.7% |
| Jul-1993 | 82.7% |
| Oct-1993 | 81.4% |
| Jan-1994 | 81.4% |
| Apr-1994 | 81.3% |
| Jul-1994 | 80.6% |
| Oct-1994 | 80.3% |
| Jan-1995 | 80.6% |
| Apr-1995 | 80.4% |
| Jul-1995 | 79.5% |
| Oct-1995 | 79.7% |
| Jan-1996 | 79.1% |
| Apr-1996 | 79.1% |
| Jul-1996 | 79.2% |
| Oct-1996 | 79.3% |
| Jan-1997 | 79.0% |
| Apr-1997 | 78.9% |
| Jul-1997 | 78.3% |
| Oct-1997 | 78.5% |
| Jan-1998 | 79.9% |
| Apr-1998 | 79.9% |
| Jul-1998 | 79.8% |
| Oct-1998 | 80.4% |
| Jan-1999 | 80.3% |
| Apr-1999 | 80.6% |
| Jul-1999 | 81.0% |
| Oct-1999 | 81.4% |
| Jan-2000 | 81.8% |
| Apr-2000 | 81.9% |
| Jul-2000 | 82.4% |
| Oct-2000 | 83.1% |
| Jan-2001 | 83.1% |
| Apr-2001 | 82.8% |
| Jul-2001 | 83.0% |
| Oct-2001 | 84.0% |
| Jan-2002 | 82.0% |
| Apr-2002 | 81.8% |
| Jul-2002 | 81.8% |
| Oct-2002 | 80.9% |
| Jan-2003 | 80.3% |
| Apr-2003 | 80.1% |
| Jul-2003 | 79.8% |
| Oct-2003 | 79.9% |
| Jan-2004 | 78.8% |
| Apr-2004 | 78.7% |
| Jul-2004 | 78.6% |
| Oct-2004 | 78.5% |
| Jan-2005 | 77.0% |
| Apr-2005 | 76.9% |
| Jul-2005 | 77.2% |
| Oct-2005 | 76.0% |
| Jan-2006 | 75.5% |
| Apr-2006 | 75.4% |
| Jul-2006 | 74.7% |
| Oct-2006 | 76.1% |
| Jan-2007 | 77.3% |
| Apr-2007 | 76.9% |
| Jul-2007 | 78.3% |
| Oct-2007 | 79.4% |
| Jan-2008 | 79.8% |
| Apr-2008 | 79.7% |
| Jul-2008 | 80.1% |
| Oct-2008 | 83.7% |
| Jan-2009 | 79.8% |
| Apr-2009 | 79.4% |
| Jul-2009 | 78.4% |
| Oct-2009 | 77.4% |
| Jan-2010 | 76.4% |
| Apr-2010 | 76.7% |
| Jul-2010 | 74.9% |
| Oct-2010 | 74.9% |
| Jan-2011 | 77.1% |
| Apr-2011 | 76.0% |
| Jul-2011 | 76.0% |
| Oct-2011 | 74.2% |
| Jan-2012 | 74.6% |
| Apr-2012 | 74.2% |
| Jul-2012 | 73.9% |
| Oct-2012 | 74.6% |
| Jan-2013 | 74.0% |
| Apr-2013 | 73.6% |
| Jul-2013 | 73.5% |
| Oct-2013 | 73.8% |
| Jan-2014 | 75.9% |
| Apr-2014 | 74.5% |
| Jul-2014 | 73.6% |
| Oct-2014 | 74.2% |
| Jan-2015 | 75.7% |
| Apr-2015 | 75.5% |
| Jul-2015 | 75.8% |
| Oct-2015 | 76.7% |
| Jan-2016 | 77.5% |
Note: Shaded areas denote recessions. Federal Reserve banks' corporate profits were netted out in the calculation of labor share.
Source: EPI analysis of Bureau of Economic Analysis National Income and Product Accounts (Tables 1.14 and 6.16D)
Given the huge upsides to aggressively plumbing the depths of how low unemployment can fall, and given the extremely small risks to pursuing this strategy today, where does this excess fear of economic overheating and inflation come from? Has a wage-price spiral ever happened in the U.S. economy?
Sort of, but it was an episode—and episode is key, as in a pretty unique one-off event—when both wage and price inflation ratcheted upwards for a sustained period. And it seemed to take a significant increase in unemployment to check this upwards ratchet.
This episode was, of course, the 1970s. But we have a very different economy today than then. The economic context, the institutions that distribute bargaining power between workers and capital owners, and the state of the economy just don’t look today like they did when we had the 1970s wage-price spiral.
To put it simply, the tinder that was available to be sparked into the inflation fire in the early 1970s just isn’t here today. What are the components of that tinder?
Recent unemployment history
- As the U.S. economy entered the 1970s, the unemployment rate in the previous 5 years averaged under 4 percent (from 65-69 it was 3.7 percent on average).
- Going into 2015, unemployment in the past 5 years has averaged 8.0 percent. And hadn’t spent a whole year below 4 percent since 1969, and spent only 2 of the previous 45 years below 4.5 percent.
Wage aspirations
- As we entered the 70s, the vast majority of American workers had gotten really used to steady, fast growth in inflation-adjusted wages.
- Average wage of production and non-supervisory workers (bottom 80 percent of the workforce) rose 2.2 percent per year in the previous business cycle.
- In 2015, the vast majority of Americans have gotten used to essentially no wage growth over the past three decades. The bottom 70 percent of real wages increased by 0.3 percent or less each year since 1979. And without the period in the late 1990s, this entire period was actually characterized by falling real wages.
Unionization rate
- The average unionization rate (share of private-sector workers covered by a union contract) in 1970 was 26 percent. In 2014 it was 7.4 percent.
Minimum wage
- The high point of the inflation-adjusted value of the federal minimum wage was 1968, when it was nearly $10 in today’s dollars. The low point of the minimum wage’s value was hit in 1989—and then essentially matched again in 2007.
This list highlights a weakness of the NAIRU-only view of wage determination. It ignores the crucial role that bargaining power plays in determining wage growth. Yes, a crucial—I think the crucial—element of bargaining power is the unemployment rate. But others things matter too, like the extent of unionization, how high a wage floor is set by minimum wages, whether it’s easier or harder for domestic firms to threaten to relocate production abroad if wage demands get too high, and whether or not important firms like Wal-Mart can act as labor market monopsonists and set wages lower than market-clearing levels.
All of this is crucial to wage determination and needs to be factored into how realistic it seems to be that a short spell of going below the NAIRU would actually unleash the inflation genie. And if you’re worried I’m caricaturing the view that the Fed needs to clamp down now to avoid a sudden outbreak of wage and price inflation, here’s a quote from an economist working in the financial sector from this past August:
“Letting inflation gather even a little bit of steam is like having a dragon egg and deciding to let the dragon grow up… we’ve all seen the show, it doesn’t go well when the dragon grows up.”
Game of Thrones reference aside, this is a very 1970s view of the world.
And in regards to the 1970s, all this stuff we just talked about earlier (low unemployment, recent history of fast wage growth, high minimum wages and unionization) just provided tinder for the inflation fire—it still needed a really big spark. That spark in the 1970s was the oil price shocks that quadrupled the price of oil over the decade. Essentially, it was like the oil producers of the globe instituted a tax on the American economy.
The initial way the oil price shock hits is to raise prices as producers just pass this through. If it had stopped there, American workers would have essentially borne the entire hit of the oil price shock. But because they had some bargaining power and were not used to seeing wages decline, they pushed back, and met the higher prices with higher wage demands. But, we know that capital owners always push back, so they passed down higher wage costs into prices. And workers pushed back again…
It took the combination of a much more empowered American working class and a really bad supply shock to get the 1970s inflation episode. And even then it’s far from clear that this episode wouldn’t have just burned itself largely out.
Could there be another oil price shock that provides the spark? It seems pretty unlikely. Oil is a much less important part of costs now then in the 1970s, and we produce a lot more of it, so, instead it just being a tax on Americans, it actually generates a lot of income within the country as well. Higher oil prices are still on net a tax on the U.S. economy, but a much smaller one. And oil prices have, of course, fallen through the floor in recent years.
Much more importantly, any inflationary spark today would fall on a floor without any tinder. Today’s American worker is not empowered and has essentially no ability to set off a wage-price spiral.
Now, in the context of debates regarding policies of the Federal Reserve, this means we can afford—actually we need—to see much lower rates of unemployment before you get much wage pressure.
In the context of delivering consistent increases in the living standards of the American working class, this is obviously terrible. We need policies that really do empower workers and can actually get them some wage increases even when unemployment is not very low. By 2006—the peak before the Great Recession hit—we had 4.6 percent unemployment for year. And yet real wage growth between 2003 and 2007 was negative for most workers. If we had stuck at 4.6 for a while, it probably would’ve picked up—but that’s the point, no?
And, the tough fact is that that the U.S. economy is usually not at very low rates of unemployment. My working lifetime began around 1993. The U.S. labor market has been tight—unemployment below 5.0 percent or below—for 7 of the 21 years of my working life. (Side note: because I’m genius, I decided to spend 5 of those 7 good years in grad school making very little money.)
So, the long run project should definitely be to empower American workers again so they are able to claim their fair share of economic growth. But if they’re going to see any wage gains at all before that happens, workers need the Fed to tolerate really low rates of unemployment, and that’s why this effort is so vital. This week’s near-certain interest rate increase is a bad sign on this front.
Notes
1. A quick refresher on why we think raising short-term rates would slow economic growth and block progress on reducing unemployment: The Fed raises short-term rates, and this puts upward pressure on longer-term rates as well. These long-term rates feed directly into credit card rates, adjustable rate mortgages, possibly student debt—which means less money in people’s pockets. These higher rates would also stop the refinancing boom that helped support the recovery (granted, that’s mostly over by now). And, these higher rates would make it more expensive for businesses that wanted to undertake big investment in plant and equipment to do it—think about a fast food or coffee chain that wanted to open new stores in a city. They need to buy retail space, buy espresso machines, sign contracts for food delivery, and have a way to pay employees to show up in the first months before they actually start generating revenue. This often requires taking on some debt. Deciding to take on this debt is easier when interest rates are low than when they are high. So, as rates go up there will likely be cutbacks in business investment. All of these influences mean that when the Fed begins raising rates, it is hoping to slow the pace of economic growth and slow downward progress in reducing unemployment
2. Sort of. Say there’s a ceiling on what the economy can sustainably deliver over long time periods. For periods, wage growth can exceed productivity growth by shrinking the share of economy-wide income that goes to capital owners—and in fact such a redistribution from profits to labor compensation really should be an explicit target in coming years to rebalance the large fall in labor’s share that occurred during the early phases of the recovery.
Enjoyed this post?
Sign up for EPI's newsletter so you never miss our research and insights on ways to make the economy work better for everyone.