A weekly presentation of downloadable charts and short analyses designed to graphically illustrate important economic issues. Updated every Wednesday.
Snapshot for January 5, 2000
The minimum wage and wage inequality among women
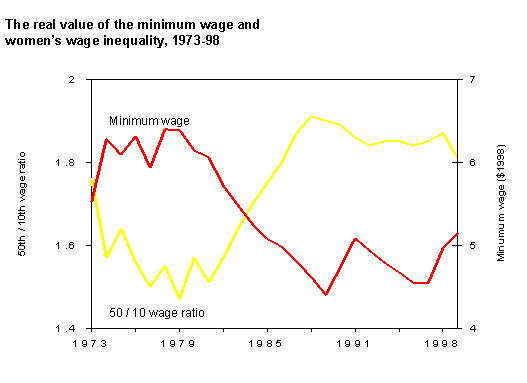
As the real value of the minimum wage eroded in the 1980s, it is not surprising that, at the same time, wage inequality among women grew. In the chart below, the red line shows the dramatic drop in the minimum wage’s inflation-adjusted value in the 1980s, a period in which there were no legislated increases. The chart’s yellow line shows the hourly wage gap between women earning a median wage (those at the 50th percentile) and those earning a low wage (i.e., women at the 10th percentile, which means that 90% of women earn more, but 10% less than this amount). As the real value of the minimum wage fell in the 1980s, the wages of women at the low end of the wage structure also fell, causing the wage gap to increase precipitously.
In recent years, the increases in the minimum wage and the low unemployment rate have helped boost women’s wages at the bottom, alleviating some of this wage inequality. Unfortunately, the wage gap still remains much higher now than it was in the late 1970s.

Source: The State of Working America 1998-99.
Check out the archive for past Economic Snapshots.
