Closing the Pay Gap and Beyond:
A Comprehensive Strategy for Improving Economic Security for Women and Families
Villanova University | Villanova Women’s Professional Network
Elise Gould
Senior Economist
Economic Policy Institute
Wednesday, September 21, 2016
Get this presentation at
go.epi.org/villanova2016
Women earn less than men at every wage level: Hourly wages by gender and wage percentile, 2015
| Men | Women | |
|---|---|---|
| 10th | $9.36 | $8.61 |
| 20th | $11.07 | $9.96 |
| 30th | $13.44 | $11.54 |
| 40th | $15.90 | $13.50 |
| 50th | $18.94 | $15.67 |
| 60th | $22.26 | $18.58 |
| 70th | $26.93 | $22.18 |
| 80th | $33.96 | $27.83 |
| 90th | $47.89 | $37.62 |
| 95th | $65.06 | $48.03 |

Source: EPI analysis of Current Population Survey Outgoing Rotation Group microdata. For more information on the data sample see EPI's State of Working America Data Library.
The gender wage gap is largest among top earners: Women’s hourly wages as a share of men’s at various wage percentiles, 1979–2015
| 10th percentile | 50th percentile | 95th percentile | |
|---|---|---|---|
| 1979-01-01 | 86.7% | 62.7% | 62.9% |
| 1980-01-01 | 83.2% | 63.4% | 64.8% |
| 1981-01-01 | 88.7% | 64.2% | 63.6% |
| 1982-01-01 | 88.9% | 64.8% | 64.8% |
| 1983-01-01 | 89.3% | 66.5% | 62.9% |
| 1984-01-01 | 87.2% | 67.4% | 64.1% |
| 1985-01-01 | 85.8% | 67.1% | 63.2% |
| 1986-01-01 | 84.7% | 66.9% | 66.2% |
| 1987-01-01 | 83.5% | 69.1% | 65.8% |
| 1988-01-01 | 81.5% | 71.1% | 68.0% |
| 1989-01-01 | 81.3% | 73.1% | 71.9% |
| 1990-01-01 | 83.4% | 74.4% | 72.7% |
| 1991-01-01 | 86.8% | 74.9% | 72.8% |
| 1992-01-01 | 89.7% | 76.2% | 73.9% |
| 1993-01-01 | 90.9% | 77.6% | 74.4% |
| 1994-01-01 | 90.8% | 78.4% | 76.3% |
| 1995-01-01 | 88.2% | 76.7% | 76.6% |
| 1996-01-01 | 87.2% | 77.6% | 77.0% |
| 1997-01-01 | 87.0% | 79.0% | 75.2% |
| 1998-01-01 | 89.4% | 78.2% | 76.7% |
| 1999-01-01 | 87.6% | 76.9% | 77.0% |
| 2000-01-01 | 87.3% | 78.0% | 75.6% |
| 2001-01-01 | 87.3% | 78.5% | 75.7% |
| 2002-01-01 | 89.6% | 80.1% | 76.2% |
| 2003-01-01 | 89.4% | 81.0% | 76.8% |
| 2004-01-01 | 89.3% | 81.8% | 75.3% |
| 2005-01-01 | 88.3% | 82.0% | 77.2% |
| 2006-01-01 | 88.8% | 82.2% | 77.9% |
| 2007-01-01 | 89.9% | 81.5% | 77.2% |
| 2008-01-01 | 90.3% | 82.6% | 77.0% |
| 2009-01-01 | 92.3% | 81.7% | 74.6% |
| 2010-01-01 | 92.9% | 83.3% | 76.8% |
| 2011-01-01 | 93.4% | 84.0% | 77.9% |
| 2012-01-01 | 91.7% | 82.8% | 74.5% |
| 2013-01-01 | 91.8% | 83.4% | 76.1% |
| 2014-01-01 | 90.9% | 82.9% | 78.6% |
| 2015-01-01 | 92.2% | 83.3% | 73.0% |
Note: The xth-percentile wage is the wage at which x% of wage earners earn less and (100-x)% earn more.
Source: EPI analysis of Current Population Survey Outgoing Rotation Group microdata
Women of color earn far less than white men: Women’s median hourly wages, by race and ethnicity, as a share of white men’s wages, 2015
| Group | Share of white men’s earnings |
|---|---|
| White women | 81.3% |
| Black women | 64.9% |
| Hispanic women | 58.1% |
| Asian women | 89.4% |
Note: Race/ethnicity categories are mutually exclusive (i.e., white non-Hispanic, black non-Hispanic, and Hispanic any race).
Source: EPI analysis of Current Population Survey Outgoing Rotation Group microdata
Women of every race and ethnicity make less than their male counterparts: Median hourly wages within race and ethnicity, 2015
| Men | Women | |
|---|---|---|
| White | $21.04 | $17.11 |
| Black | $14.86 | $13.66 |
| Hispanic | $14.49 | $12.22 |
| Asian | $24.80 | $18.81 |
Source: EPI analysis of Current Population Survey Outgoing Rotation Group microdata
Women of every race and ethnicity make less than their male counterparts: Women's hourly wages as a percentage of men's hourly wages of the same race, by income percentile, 2015
| Within Race Gender Wage Gap | White | Black | Hispanic | Asian |
|---|---|---|---|---|
| 10th | 89.6% | 96.2% | 91.7% | 91.2% |
| 50th | 81.3% | 91.9% | 84.3% | 75.9% |
| 95th | 59.1% | 94.3% | 86.4% | 62.0% |
Source: EPI analysis of Current Population Survey microdata
Pennsylvania has the 6th largest gap between women's and men's pay: Median hourly wage gender ratio by state, 2013 – 2015
| State | Gender pay ratio (female/male hourly earnings) |
|---|---|
| Alabama | 79.8% |
| Alaska | 85.9% |
| Arizona | 84.4% |
| Arkansas | 86.6% |
| California | 87.7% |
| Colorado | 84.3% |
| Connecticut | 80.0% |
| Delaware | 85.3% |
| Washington D.C. | 92.6% |
| Florida | 85.8% |
| Georgia | 86.2% |
| Hawaii | 88.3% |
| Idaho | 84.1% |
| Illinois | 84.5% |
| Indiana | 82.0% |
| Iowa | 82.8% |
| Kansas | 81.1% |
| Kentucky | 83.7% |
| Louisiana | 77.8% |
| Maine | 86.2% |
| Maryland | 86.8% |
| Massachusetts | 82.3% |
| Michigan | 81.0% |
| Minnesota | 86.2% |
| Mississippi | 83.6% |
| Missouri | 79.2% |
| Montana | 81.6% |
| Nebraska | 83.1% |
| Nevada | 87.0% |
| New Hampshire | 81.7% |
| New Jersey | 80.7% |
| New Mexico | 80.6% |
| New York | 86.4% |
| North Carolina | 87.9% |
| North Dakota | 81.3% |
| Ohio | 82.8% |
| Oklahoma | 80.3% |
| Oregon | 86.6% |
| Pennsylvania | 79.4% |
| Rhode Island | 84.0% |
| South Carolina | 86.2% |
| South Dakota | 84.0% |
| Tennessee | 88.1% |
| Texas | 82.2% |
| Utah | 75.3% |
| Vermont | 91.2% |
| Virginia | 83.8% |
| Washington | 80.3% |
| West Virginia | 79.0% |
| Wisconsin | 81.5% |
| Wyoming | 75.0% |
Notes: Values represent averages 2013- 2015.
Source: EPI analysis of Current Population Survey microdata.
Women earn less than men at every education level: Average hourly wages, by gender and education, 2015
| Education level | Men | Women |
|---|---|---|
| Less than high school | $13.93 | $10.89 |
| High school | $18.61 | $14.57 |
| Some college | $20.95 | $16.59 |
| College | $35.23 | $26.51 |
| Advanced degree | $45.84 | $33.65 |
Source: EPI analysis of Current Population Survey Outgoing Rotation Group microdata. For more information on the data sample see EPI's State of Working America Data Library.
Women arrive at college less interested in STEM fields as compared to their male counterparts: Intent of first-year college students to major in STEM fields, by gender, 2014
| Intended major | Percentage of men | Percentage of women |
|---|---|---|
| Biological and life sciences | 11% | 16% |
| Engineering | 19% | 6% |
| Chemistry | 1% | 1% |
| Computer science | 6% | 1% |
| Mathematics/ statistics | 1% | 1% |
| Physics | 1% | 0.3% |
Source: EPI adaptation of AAUW (2015) analysis of Eagan et al. (2014).
Undergraduate majors favored by women pay less ten years after graduation: Undergraduate major selection by gender and salary ten years after graduation
| Undergraduate major | Salary 10 years after graduation | Percent of male graduates | Percent of female graduates |
|---|---|---|---|
| Engineering | $90,170 | 11.90% | 1.57% |
| Mathematics & science | $72,908 | 7.57% | 4.23% |
| Business and management | $70,847 | 26.13% | 18.65% |
| Health professions | $68,271 | 4.07% | 10.07% |
| Social science | $64,407 | 10.35% | 8.86% |
| Biological sciences | $60,542 | 5.09% | 3.89% |
| History | $60,542 | 2.43% | 1.29% |
| Other | $58,997 | 12.99% | 14.37% |
| Public affairs/social services | $52,814 | 3.04% | 3.70% |
| Humanities | $52,814 | 8.33% | 10.07% |
| Psychology | $51,525 | 2.10% | 4.86% |
| Education | $47,403 | 6.00% | 18.46% |
Notes: Computation by NCES PowerStats on 2/26/2016. Salaries ten years after graduation, or 2003, are shown in 2015 dollars.
Source: EPI analysis of National Center for Education Statistics B&B: 93/03 Baccalaureate and Beyond Longitudinal Study data.
How does the gender pay gap change after a woman has children?
- Pay
- Labor Market Experience
- Hours
Pay
- Budig (2014) finds a 4.6% motherhood penalty on women’s hourly wages after controlling for fixed effects, marital status, human capital differences, and a preference for family-friendly jobs.
- Data: National Longitudinal Survey of Youth data (1979-2004) from the Bureau of Labor Statistics
- Correll, Benard, and InPaik (2007) explore the role of discrimination and find mothers were recommended to be offered on average $11,000 less than childless women and $13,000 less than fathers.
Labor Market Experience
- Bertrand Goldin Katz (2009) find that career interruptions and weekly hours worked predominantly account for differences in earnings growth between men and women MBAs during their first 15 years after completion of their MBA.
- Women are 22 percent more likely than men to have a career interruption (6 months or more).
- Female MBAs with children have 8 months less work experience than male MBAs at 15 years post-MBA, compared to 1.5 months for women without children.
- Budig (2014) finds reduced human capital accounts for only one-third of the motherhood penalty.
Hours
- Claudia Goldin (2014) suggests that women in high-wage professions are penalized for not working long, inflexible hours that often come with many professional jobs, due to the arrival of children, regardless of their productivity per hour.
Ways to help eliminate the gender wage gap include:
- Change the culture of work to emphasize work-life balance
- Deter the segregation of genders into specific occupations
- Strongly enforce anti-discrimination laws
- Require more transparency in compensation data
- Pass comparable-worth laws that ensure women are paid the same as men in equally valuable jobs, or with similar education or skills levels
- Address the distribution of unpaid car work in the household by making it easier and more affordable for both men and women to spend more time at home, such as through the provision of paid family leave
Average annual family income growth, by income group, 1947–2015
| 1947-1979 | 1979-2007 | 2007-2015 | |
|---|---|---|---|
| Lowest fifth | 2.52% | 0.02% | -0.48% |
| Second fifth | 2.21% | 0.37% | -0.50% |
| Third fifth | 2.39% | 0.59% | -0.30% |
| Fourth fifth | 2.43% | 0.89% | -0.09% |
| 80th-95th percentile | 2.36% | 1.17% | -0.11% |
| Top 5 percent | 1.86% | 1.99% | 0.41% |
Note: Data are for money income. Because of a redesign in the CPS ASEC income questions in 2013, we imputed the historical series using the ratio of the old and new method in 2013.
Source: EPI analysis of Current Population Survey Annual Social and Economic Supplement Historical Income Tables (Table F-3)
Updated from: Figure 2C in The State of Working America, 12th Edition (Mishel et al. 2012), an Economic Policy Institute book published by Cornell University Press in 2012
Outsized increases in real annual income within the top one percent are driving up the average within the top 10 percent: Change in real annual household income, by income group, 1979–2011
| Bottom 90 percent | 91st–99th percentile | Top 1 percent | |
|---|---|---|---|
| Jul-1979 | 0.0% | 0.0% | 0.0% |
| Jul-1980 | -3.0% | -3.0% | -4.8% |
| Jul-1981 | -3.2% | -3.8% | -5.3% |
| Jul-1982 | -4.2% | -4.5% | -0.8% |
| Jul-1983 | -4.9% | -1.8% | 8.8% |
| Jul-1984 | -0.5% | 5.7% | 20.1% |
| Jul-1985 | 0.1% | 6.3% | 28.4% |
| Jul-1986 | 3.4% | 14.5% | 68.4% |
| Jul-1987 | 3.6% | 14.5% | 36.0% |
| Jul-1988 | 5.3% | 17.8% | 70.6% |
| Jul-1989 | 7.0% | 20.1% | 59.1% |
| Jul-1990 | 7.0% | 16.6% | 52.8% |
| Jul-1991 | 5.7% | 14.7% | 36.7% |
| Jul-1992 | 6.8% | 18.1% | 55.1% |
| Jul-1993 | 8.1% | 18.7% | 49.1% |
| Jul-1994 | 9.3% | 20.8% | 53.5% |
| Jul-1995 | 12.2% | 25.9% | 70.6% |
| Jul-1996 | 13.6% | 30.3% | 87.6% |
| Jul-1997 | 15.8% | 36.4% | 115.4% |
| Jul-1998 | 19.5% | 42.1% | 143.0% |
| Jul-1999 | 22.5% | 48.1% | 163.3% |
| Jul-2000 | 22.0% | 51.7% | 186.7% |
| Jul-2001 | 21.9% | 43.3% | 126.7% |
| Jul-2002 | 19.1% | 39.3% | 100.5% |
| Jul-2003 | 19.5% | 42.5% | 112.6% |
| Jul-2004 | 23.3% | 49.2% | 153.3% |
| Jul-2005 | 25.3% | 57.4% | 205.3% |
| Jul-2006 | 27.6% | 61.6% | 229.0% |
| Jul-2007 | 30.0% | 66.2% | 244.4% |
| Jul-2008 | 25.4% | 55.1% | 178.5% |
| Jul-2009 | 24.6% | 48.5% | 118.6% |
| Jul-2010 | 24.8% | 52.6% | 153.6% |
| Jul-2011 | 23.3% | 53.2% | 149.1% |
Note: Data are for comprehensive income. Shaded areas denote recessions.
Source: Authors' analysis of data from the Congressional Budget Office (2014)
The U.S. middle class had $17,867 less income in 2007 because of the growth of inequality since 1979: Household income of the broad middle class, actual and projected assuming no growth in inequality, 1979–2011
| Actual | Projected | |
|---|---|---|
| 1979/01/01 | $61,542.17 | $61,542.17 |
| 1980/01/01 | $59,460.37 | $59,579.37 |
| 1981/01/01 | $59,210.54 | $59,456.53 |
| 1982/01/01 | $58,036.98 | $59,071.83 |
| 1983/01/01 | $57,202.97 | $59,479.82 |
| 1984/01/01 | $60,446.87 | $62,779.71 |
| 1985/01/01 | $60,428.61 | $63,811.15 |
| 1986/01/01 | $62,282.04 | $68,495.45 |
| 1987/01/01 | $61,406.97 | $66,243.89 |
| 1988/01/01 | $62,294.60 | $69,102.25 |
| 1989/01/01 | $63,153.24 | $69,773.54 |
| 1990/01/01 | $63,356.58 | $69,050.00 |
| 1991/01/01 | $62,372.76 | $67,405.82 |
| 1992/01/01 | $62,736.36 | $69,303.97 |
| 1993/01/01 | $63,537.30 | $69,703.89 |
| 1994/01/01 | $63,937.79 | $70,532.26 |
| 1995/01/01 | $65,895.09 | $73,271.98 |
| 1996/01/01 | $66,618.03 | $75,655.23 |
| 1997/01/01 | $67,717.28 | $78,559.19 |
| 1998/01/01 | $70,025.47 | $82,314.50 |
| 1999/01/01 | $71,827.31 | $85,754.07 |
| 2000/01/01 | $71,685.32 | $87,083.66 |
| 2001/01/01 | $71,738.64 | $82,561.12 |
| 2002/01/01 | $70,107.92 | $79,126.24 |
| 2003/01/01 | $70,232.82 | $80,397.74 |
| 2004/01/01 | $72,563.23 | $85,031.93 |
| 2005/01/01 | $73,700.24 | $89,259.28 |
| 2006/01/01 | $74,417.13 | $91,994.00 |
| 2007/01/01 | $76,442.90 | $94,310.00 |
| 2008/01/01 | $73,539.98 | $86,971.41 |
| 2009/01/01 | $72,708.64 | $82,490.43 |
| 2010/01/01 | $72,875.68 | $84,737.13 |
| 2011/01/01 | $72,036.33 | $83,665.79 |
Note: Data show average income of households in the middle three-fifths.
Source: EPI analysis of data from The Distribution of Household Income and Federal Taxes, 2011, the Congressional Budget Office, 2014.
Reproduced from Figure I in Raising America’s Pay: Why It’s Our Central Economic Policy Challenge, by Josh Bivens, Elise Gould, Lawrence Mishel, and Heidi Shierholz, Economic Policy Institute, 2014.
Middle-class wages are stagnant— Middle-wage workers' hourly wage is up 7% since 1979, low-wage workers' wages are down 1%, while those with very high wages saw a 48% increase: Cumulative change in real hourly wages of all workers, by wage percentile,* 1979–2015
| YEAR | 10th percentile | 50th percentile | 95th percentile |
|---|---|---|---|
| 1979 | 0.00% | 0.00% | 0.00% |
| 1980 | -5.51% | -1.02% | -1.94% |
| 1981 | -4.05% | -3.57% | -1.73% |
| 1982 | -7.67% | -2.23% | 0.15% |
| 1983 | -10.54% | -2.73% | 3.35% |
| 1984 | -12.70% | -2.26% | 4.16% |
| 1985 | -14.15% | -1.39% | 5.99% |
| 1986 | -14.29% | 0.52% | 7.55% |
| 1987 | -14.53% | 0.55% | 7.37% |
| 1988 | -14.52% | -0.07% | 10.06% |
| 1989 | -14.62% | -0.63% | 7.44% |
| 1990 | -13.16% | -0.65% | 9.56% |
| 1991 | -11.55% | -0.06% | 10.22% |
| 1992 | -11.71% | 0.80% | 8.51% |
| 1993 | -12.05% | 0.07% | 7.51% |
| 1994 | -12.94% | -1.65% | 13.14% |
| 1995 | -13.08% | -2.40% | 13.24% |
| 1996 | -13.51% | -2.84% | 13.77% |
| 1997 | -10.58% | -0.58% | 15.11% |
| 1998 | -5.71% | 2.24% | 18.02% |
| 1999 | -4.39% | 5.36% | 21.43% |
| 2000 | -3.52% | 5.05% | 25.13% |
| 2001 | -0.46% | 7.28% | 27.59% |
| 2002 | 0.67% | 8.20% | 31.92% |
| 2003 | 0.16% | 9.46% | 30.16% |
| 2004 | -1.18% | 9.48% | 31.48% |
| 2005 | -2.91% | 8.21% | 32.34% |
| 2006 | -2.30% | 8.67% | 33.07% |
| 2007 | -1.08% | 7.75% | 36.02% |
| 2008 | -1.99% | 8.17% | 37.46% |
| 2009 | -1.21% | 9.95% | 38.84% |
| 2010 | -1.99% | 8.52% | 38.53% |
| 2011 | -4.39% | 5.62% | 37.02% |
| 2012 | -5.99% | 4.95% | 38.93% |
| 2013 | -5.37% | 5.97% | 40.43% |
| 2014 | -4.12% | 5.53% | 39.08% |
| 2015 | -0.92% | 7.31% | 47.96% |
* The xth-percentile wage is the wage at which x% of wage earners earn less and (100-x)% earn more.
Note: Shaded areas denote recessions.
Source: EPI analysis of Current Population Survey Outgoing Rotation Group microdata
When it comes to the pace of annual pay increases, the top 1% wage grew 149% since 1979, while wages for the bottom 90% grew 17%: Cumulative change in real annual wages, by wage group, 1979–2014
| Year | Top 1% | Bottom 90% |
|---|---|---|
| 1979 | 0.0% | 0.0% |
| 1980 | 3.4% | -2.2% |
| 1981 | 3.1% | -2.6% |
| 1982 | 9.5% | -3.9% |
| 1983 | 13.6% | -3.7% |
| 1984 | 20.7% | -1.8% |
| 1985 | 23.0% | -1.0% |
| 1986 | 32.6% | 1.1% |
| 1987 | 53.5% | 2.1% |
| 1988 | 68.7% | 2.2% |
| 1989 | 63.3% | 1.8% |
| 1990 | 64.8% | 1.1% |
| 1991 | 53.6% | 0.0% |
| 1992 | 74.3% | 1.5% |
| 1993 | 67.9% | 0.9% |
| 1994 | 63.4% | 2.0% |
| 1995 | 70.2% | 2.8% |
| 1996 | 79.0% | 4.1% |
| 1997 | 100.6% | 7.0% |
| 1998 | 113.1% | 11.0% |
| 1999 | 129.7% | 13.2% |
| 2000 | 144.8% | 15.3% |
| 2001 | 130.4% | 15.7% |
| 2002 | 109.3% | 15.6% |
| 2003 | 113.9% | 15.7% |
| 2004 | 127.2% | 15.6% |
| 2005 | 135.3% | 15.0% |
| 2006 | 143.4% | 15.7% |
| 2007 | 156.2% | 16.7% |
| 2008 | 137.5% | 16.0% |
| 2009 | 116.2% | 16.0% |
| 2010 | 130.9% | 15.2% |
| 2011 | 134.1% | 14.6% |
| 2012 | 148.5% | 14.7% |
| 2013 | 137.6% | 15.2% |
| 2014 | 149.4% | 16.7% |
Source: EPI analysis of data from Kopczuk, Saez, and Song (2010) and Social Security Administration wage statistics
Reproduced from Figure F in Raising America’s Pay: Why It’s Our Central Economic Policy Challenge
Source: EPI analysis of data from “Earnings Inequality and Mobility in the United States: Evidence from Social Security Data Since 1937,” by Wojciech Kopczuk, Emmanuel Saez, and Jae Song, The Quarterly Journal of Economics, February 2010; updated through 2013 with data from the Social Security Administration Wage Statistics database.
Reproduced from Figure F in Raising America’s Pay: Why It’s Our Central Economic Policy Challenge, by Josh Bivens, Elise Gould, Lawrence Mishel, and Heidi Shierholz, Economic Policy Institute, 2014.
Disconnect between productivity and a typical worker's compensation, 1948–2015
| Year | Hourly compensation | Net productivity |
|---|---|---|
| 1948 | 0.00% | 0.00% |
| 1949 | 6.25% | 1.55% |
| 1950 | 10.48% | 9.33% |
| 1951 | 11.75% | 12.35% |
| 1952 | 15.04% | 15.63% |
| 1953 | 20.84% | 19.55% |
| 1954 | 23.52% | 21.56% |
| 1955 | 28.74% | 26.46% |
| 1956 | 33.94% | 26.66% |
| 1957 | 37.14% | 30.09% |
| 1958 | 38.16% | 32.78% |
| 1959 | 42.55% | 37.64% |
| 1960 | 45.49% | 40.05% |
| 1961 | 47.99% | 44.36% |
| 1962 | 52.47% | 49.79% |
| 1963 | 55.02% | 55.01% |
| 1964 | 58.50% | 59.99% |
| 1965 | 62.46% | 64.94% |
| 1966 | 64.89% | 70.00% |
| 1967 | 66.89% | 72.05% |
| 1968 | 70.73% | 77.16% |
| 1969 | 74.66% | 77.88% |
| 1970 | 76.59% | 80.37% |
| 1971 | 82.01% | 87.10% |
| 1972 | 91.24% | 92.05% |
| 1973 | 91.29% | 96.75% |
| 1974 | 86.96% | 93.66% |
| 1975 | 86.84% | 97.92% |
| 1976 | 89.66% | 103.44% |
| 1977 | 93.13% | 105.79% |
| 1978 | 95.96% | 107.79% |
| 1979 | 93.43% | 108.14% |
| 1980 | 88.56% | 106.57% |
| 1981 | 87.59% | 111.02% |
| 1982 | 87.76% | 107.88% |
| 1983 | 88.35% | 114.13% |
| 1984 | 86.94% | 119.73% |
| 1985 | 86.31% | 123.43% |
| 1986 | 87.32% | 127.99% |
| 1987 | 84.59% | 129.12% |
| 1988 | 83.85% | 131.78% |
| 1989 | 83.70% | 133.65% |
| 1990 | 82.22% | 136.98% |
| 1991 | 81.87% | 138.89% |
| 1992 | 83.04% | 147.56% |
| 1993 | 83.38% | 148.37% |
| 1994 | 83.82% | 150.75% |
| 1995 | 82.70% | 150.86% |
| 1996 | 82.79% | 156.92% |
| 1997 | 84.80% | 160.50% |
| 1998 | 89.17% | 165.71% |
| 1999 | 91.92% | 172.08% |
| 2000 | 92.90% | 178.50% |
| 2001 | 95.56% | 182.84% |
| 2002 | 99.38% | 190.72% |
| 2003 | 101.63% | 200.17% |
| 2004 | 100.84% | 208.21% |
| 2005 | 100.05% | 213.58% |
| 2006 | 100.21% | 215.48% |
| 2007 | 101.70% | 217.70% |
| 2008 | 101.71% | 218.24% |
| 2009 | 109.69% | 224.75% |
| 2010 | 111.53% | 234.28% |
| 2011 | 109.06% | 234.67% |
| 2012 | 107.27% | 236.51% |
| 2013 | 108.32% | 237.57% |
| 2014 | 109.13% | 239.30% |
| 2015 | 112.53% | 241.08% |
Note: Data are for average hourly compensation of production/nonsupervisory workers in the private sector and net productivity of the total economy. "Net productivity" is the growth of output of goods and services minus depreciation per hour worked.
Source: EPI analysis of data from the BEA and BLS (see technical appendix of Understanding the Historic Divergence Between Productivity and a Typical Worker's Pay for more detailed information)
Source: Economic Policy Institute analysis of data from the Bureau of Economic Analysis' National Income and Produce Accounts and the Bureau of Labor Statistics' Consumer Price Indexes and Labor Productivity and Costs programs (see technical appendix of Understanding the Historic Divergence Between Productivity and a Typical Worker's Pay for more detailed information)
What should you be making?
EPI Wage Calculator
The gender wage gap persists, but has narrowed since 1979: Median hourly wages, by gender, 1979–2015
| Year | Men’s median hourly wages | Women’s median hourly wages |
|---|---|---|
| 1979-01-01 | $20.20 | $12.68 |
| 1980-01-01 | $19.88 | $12.64 |
| 1981-01-01 | $19.47 | $12.52 |
| 1982-01-01 | $19.32 | $12.54 |
| 1983-01-01 | $19.06 | $12.68 |
| 1984-01-01 | $18.96 | $12.79 |
| 1985-01-01 | $19.14 | $12.85 |
| 1986-01-01 | $19.69 | $13.18 |
| 1987-01-01 | $19.57 | $13.52 |
| 1988-01-01 | $19.20 | $13.65 |
| 1989-01-01 | $18.64 | $13.63 |
| 1990-01-01 | $18.05 | $13.62 |
| 1991-01-01 | $18.05 | $13.67 |
| 1992-01-01 | $17.99 | $13.76 |
| 1993-01-01 | $17.83 | $13.91 |
| 1994-01-01 | $17.69 | $13.87 |
| 1995-01-01 | $17.96 | $13.78 |
| 1996-01-01 | $17.84 | $13.84 |
| 1997-01-01 | $17.95 | $14.18 |
| 1998-01-01 | $18.59 | $14.54 |
| 1999-01-01 | $19.06 | $14.67 |
| 2000-01-01 | $19.18 | $14.96 |
| 2001-01-01 | $19.44 | $15.27 |
| 2002-01-01 | $19.54 | $15.66 |
| 2003-01-01 | $19.37 | $15.69 |
| 2004-01-01 | $19.13 | $15.67 |
| 2005-01-01 | $18.97 | $15.55 |
| 2006-01-01 | $18.94 | $15.57 |
| 2007-01-01 | $19.26 | $15.71 |
| 2008-01-01 | $19.15 | $15.81 |
| 2009-01-01 | $19.68 | $16.08 |
| 2010-01-01 | $19.18 | $15.98 |
| 2011-01-01 | $18.67 | $15.69 |
| 2012-01-01 | $18.62 | $15.41 |
| 2013-01-01 | $18.42 | $15.37 |
| 2014-01-01 | $18.37 | $15.23 |
| 2015-01-01 | $18.84 | $15.69 |
Source: EPI analysis of Current Population Survey Outgoing Rotation Group microdata
All workers’ wages—regardless of gender, race, or ethnicity—have failed to rise in tandem with productivity: Hourly median wage growth by gender, race, and ethnicity, compared with economy-wide productivity growth, 1979–2015
| Date | White men | White women | Black men | Black women | Productivity |
|---|---|---|---|---|---|
| 1979 | 0.0% | 0.0% | 0.0% | 0.0% | 0.0% |
| 1980 | -2.9% | -0.7% | -1.6% | -2.1% | -0.8% |
| 1981 | -4.5% | -2.2% | -2.6% | -0.3% | 1.4% |
| 1982 | -3.4% | -0.5% | -6.3% | -1.3% | -0.1% |
| 1983 | -5.0% | 0.9% | -6.8% | -2.7% | 2.9% |
| 1984 | -6.3% | 1.6% | -5.4% | -1.3% | 5.6% |
| 1985 | -2.3% | 2.2% | -8.0% | 1.4% | 7.3% |
| 1986 | -2.9% | 5.3% | -4.1% | 3.4% | 9.5% |
| 1987 | -5.3% | 7.9% | -6.0% | 2.5% | 10.1% |
| 1988 | -4.9% | 9.0% | -4.5% | 3.9% | 11.4% |
| 1989 | -5.2% | 8.1% | -8.5% | 6.5% | 12.3% |
| 1990 | -7.1% | 8.8% | -10.5% | 4.0% | 13.9% |
| 1991 | -7.1% | 9.4% | -10.7% | 5.5% | 14.8% |
| 1992 | -7.1% | 11.1% | -11.2% | 4.9% | 18.9% |
| 1993 | -8.6% | 12.1% | -11.0% | 7.1% | 19.3% |
| 1994 | -10.0% | 11.5% | -11.2% | 5.3% | 20.5% |
| 1995 | -9.2% | 11.8% | -11.9% | 3.9% | 20.5% |
| 1996 | -8.7% | 13.4% | -12.5% | 3.4% | 23.4% |
| 1997 | -6.6% | 14.2% | -10.0% | 5.7% | 25.2% |
| 1998 | -4.0% | 17.5% | -7.9% | 10.3% | 27.7% |
| 1999 | -1.2% | 20.9% | -2.6% | 10.9% | 30.7% |
| 2000 | -2.2% | 21.7% | -4.0% | 15.3% | 33.8% |
| 2001 | 0.3% | 24.7% | -0.1% | 13.3% | 35.9% |
| 2002 | 0.1% | 27.8% | -0.7% | 17.2% | 39.7% |
| 2003 | 1.8% | 29.2% | -1.8% | 20.0% | 44.2% |
| 2004 | 0.8% | 28.8% | 1.0% | 21.7% | 48.1% |
| 2005 | -1.1% | 29.5% | -4.9% | 15.0% | 50.7% |
| 2006 | -0.6% | 28.8% | -2.3% | 18.5% | 51.6% |
| 2007 | 0.9% | 29.2% | -3.1% | 16.3% | 52.6% |
| 2008 | 0.0% | 28.4% | -3.5% | 15.0% | 52.9% |
| 2009 | 3.3% | 31.2% | -0.1% | 20.1% | 56.0% |
| 2010 | 1.7% | 30.8% | -1.8% | 18.9% | 60.6% |
| 2011 | -1.8% | 29.9% | -6.1% | 15.4% | 60.8% |
| 2012 | -2.7% | 28.3% | -6.1% | 12.9% | 61.7% |
| 2013 | -3.8% | 29.6% | -4.8% | 15.4% | 62.2% |
| 2014 | -3.5% | 29.2% | -8.2% | 12.4% | 63.0% |
| 2015 | -1.0% | 31.8% | -6.4% | 14.5% | 63.9% |
Note: Race/ethnicity categories are mutually exclusive (i.e., white non-Hispanic, black non-Hispanic, and Hispanic any race).
Source: EPI analysis of unpublished Total Economy Productivity data from Bureau of Labor Statistics Labor Productivity and Costs program, and Current Population Survey Outgoing Rotation Group microdata
Eliminating the gender and inequality wage gap could raise women’s wages by 69%: Median hourly wages for men and women, compared with wages for all workers had they increased in tandem with productivity, 1979–2015
| Year | Wages for all workers | Men’s wages | Women’s wages | Wages for all workers had they grown in tandem with productivity |
|---|---|---|---|---|
| 1979 | $16.15 | $20.30 | $12.66 | $16.15 |
| 1980 | $16.07 | $19.98 | $12.60 | $16.03 |
| 1981 | $15.66 | $19.52 | $12.53 | $16.38 |
| 1982 | $15.75 | $19.30 | $12.61 | $16.13 |
| 1983 | $15.71 | $19.18 | $12.76 | $16.62 |
| 1984 | $15.71 | $19.15 | $12.93 | $17.05 |
| 1985 | $15.80 | $19.10 | $12.98 | $17.34 |
| 1986 | $16.27 | $19.70 | $13.26 | $17.70 |
| 1987 | $16.12 | $19.75 | $13.64 | $17.78 |
| 1988 | $16.10 | $19.23 | $13.64 | $17.99 |
| 1989 | $16.06 | $18.57 | $13.71 | $18.13 |
| 1990 | $15.85 | $18.12 | $13.62 | $18.39 |
| 1991 | $15.94 | $18.06 | $13.68 | $18.54 |
| 1992 | $15.98 | $18.10 | $13.82 | $19.21 |
| 1993 | $16.06 | $17.87 | $14.02 | $19.28 |
| 1994 | $15.80 | $17.67 | $13.98 | $19.46 |
| 1995 | $15.58 | $17.91 | $13.85 | $19.47 |
| 1996 | $15.65 | $17.93 | $13.87 | $19.94 |
| 1997 | $16.04 | $17.85 | $14.14 | $20.22 |
| 1998 | $16.49 | $18.65 | $14.54 | $20.62 |
| 1999 | $16.97 | $19.10 | $14.73 | $21.12 |
| 2000 | $16.83 | $19.20 | $15.03 | $21.61 |
| 2001 | $17.27 | $19.44 | $15.31 | $21.95 |
| 2002 | $17.27 | $19.64 | $15.72 | $22.56 |
| 2003 | $17.56 | $19.35 | $15.61 | $23.30 |
| 2004 | $17.55 | $19.17 | $15.69 | $23.92 |
| 2005 | $17.40 | $18.95 | $15.63 | $24.34 |
| 2006 | $17.51 | $18.91 | $15.58 | $24.49 |
| 2007 | $17.21 | $19.21 | $15.70 | $24.66 |
| 2008 | $17.30 | $19.06 | $15.85 | $24.70 |
| 2009 | $17.65 | $19.75 | $16.06 | $25.20 |
| 2010 | $17.40 | $19.09 | $15.92 | $25.94 |
| 2011 | $16.92 | $18.60 | $15.74 | $25.97 |
| 2012 | $16.83 | $18.59 | $15.44 | $26.12 |
| 2013 | $16.95 | $18.38 | $15.32 | $26.20 |
| 2014 | $16.90 | $18.41 | $15.14 | $26.33 |
| 2015 | 17.11 | 18.94 | 15.67 | 26.47 |
Source: Reproduced from Figure G in Alyssa Davis and Elise Gould, Closing the Pay Gap and Beyond:
A Comprehensive Strategy for Improving Economic Security for Women and Families, EPI Briefing Paper #412, November 18, 2015

The minimum wage would be over $18 had it risen along with productivity: Real value of the federal minimum wage compared with its value had it grown at the rate of productivity and average hourly wages, 1968–2014
| Year | Real minimum wage | Real hourly wage | Productivity |
|---|---|---|---|
| 1968 | $ 9.58 | $ 9.58 | $ 9.58 |
| 1969 | $ 9.17 | $ 9.78 | $ 9.62 |
| 1970 | $ 8.75 | $ 9.85 | $ 9.76 |
| 1971 | $ 8.38 | $ 10.07 | $ 10.12 |
| 1972 | $ 8.14 | $ 10.51 | $ 10.39 |
| 1973 | $ 7.65 | $ 10.49 | $ 10.64 |
| 1974 | $ 8.70 | $ 10.21 | $ 10.47 |
| 1975 | $ 8.44 | $ 10.07 | $ 10.70 |
| 1976 | $ 8.74 | $ 10.19 | $ 11.00 |
| 1977 | $ 8.22 | $ 10.30 | $ 11.13 |
| 1978 | $ 8.86 | $ 10.42 | $ 11.24 |
| 1979 | $ 8.85 | $ 10.25 | $ 11.26 |
| 1980 | $ 8.52 | $ 9.97 | $ 11.17 |
| 1981 | $ 8.40 | $ 9.89 | $ 11.41 |
| 1982 | $ 7.93 | $ 9.86 | $ 11.24 |
| 1983 | $ 7.60 | $ 9.86 | $ 11.58 |
| 1984 | $ 7.30 | $ 9.80 | $ 11.88 |
| 1985 | $ 7.06 | $ 9.76 | $ 12.08 |
| 1986 | $ 6.93 | $ 9.79 | $ 12.33 |
| 1987 | $ 6.71 | $ 9.70 | $ 12.39 |
| 1988 | $ 6.47 | $ 9.66 | $ 12.54 |
| 1989 | $ 6.20 | $ 9.61 | $ 12.64 |
| 1990 | $ 6.70 | $ 9.53 | $ 12.82 |
| 1991 | $ 7.24 | $ 9.48 | $ 12.92 |
| 1992 | $ 7.06 | $ 9.47 | $ 13.39 |
| 1993 | $ 6.89 | $ 9.49 | $ 13.43 |
| 1994 | $ 6.74 | $ 9.53 | $ 13.56 |
| 1995 | $ 6.58 | $ 9.56 | $ 13.57 |
| 1996 | $ 7.17 | $ 9.63 | $ 13.90 |
| 1997 | $ 7.61 | $ 9.79 | $ 14.09 |
| 1998 | $ 7.50 | $ 10.04 | $ 14.37 |
| 1999 | $ 7.35 | $ 10.20 | $ 14.72 |
| 2000 | $ 7.11 | $ 10.26 | $ 15.07 |
| 2001 | $ 6.92 | $ 10.35 | $ 15.30 |
| 2002 | $ 6.81 | $ 10.48 | $ 15.73 |
| 2003 | $ 6.66 | $ 10.53 | $ 16.24 |
| 2004 | $ 6.48 | $ 10.46 | $ 16.68 |
| 2005 | $ 6.27 | $ 10.40 | $ 16.97 |
| 2006 | $ 6.07 | $ 10.47 | $ 17.07 |
| 2007 | $ 6.71 | $ 10.58 | $ 17.19 |
| 2008 | $ 7.23 | $ 10.57 | $ 17.22 |
| 2009 | $ 8.04 | $ 10.93 | $ 17.58 |
| 2010 | $ 7.91 | $ 11.01 | $ 18.09 |
| 2011 | $ 7.66 | $ 10.89 | $ 18.12 |
| 2012 | $ 7.51 | $ 10.83 | $ 18.26 |
| 2013 | $ 7.40 | $ 10.89 | $ 18.43 |
| 2014 | $ 7.25 | $ 10.89 | $ 18.42 |
Note: Real average hourly wages are of production/nonsupervisory workers in the private sector, and productivity is net productivity of the total economy.
Source: EPI analysis of data from the U.S. Department of Labor's Bureau of Labor Statistics and Labor Wage and Hour Division
Source: Productivity data are unpublished data from the BLS Labor Productivity and Costs program's Major Sector Productivity and Costs and Industry Productivity and Costs databases; wage data come from the BLS Current Employment Statistics program's Employment, Hours and Earnings—National database; Current Population Survey Outgoing Rotation Group microdata from the CPS survey conducted by the Bureau of the Census for the Bureau of Labor Statistics; and U.S. Department of Labor Wage and Hour Division's online chart, “History of Federal Minimum Wage Rates Under the Fair Labor Standards Act, 1938-2009.”
Adapted from Raising the Federal Minimum Wage to $10.10 Would Save Safety Net Programs Billions and Help Ensure Businesses Are Doing Their Fair Share, by David Cooper, Economic Policy Institute, 2014.
A higher minimum wage would give many working women a raise: Share of workers who would get a raise from increasing the federal minimum wage to $12 by 2020, by gender, race, and household composition
| Share of each group that would get a raise by increasing the federal minimum wage to $12 by 2020 | |
|---|---|
| Women | 29.6% |
| Working mothers | 27.3% |
| Single mothers | 39.6% |
| Women of color | 37.1% |
Source: Adapted from Cooper (2015)
Tipped workers make significantly less than other workers, and are more likely to be women: Share of tipped workers and all workers who are women
| Women | Men | |
|---|---|---|
| Tipped workers | 66.60% | 33.40% |
| 0 | ||
| All workers | 48.30% | 51.70% |
| 0 |
Source: EPI analysis of Current Population Survey Outgoing Rotation Group microdata, 2011–2013
The majority of workers in the largest low-wage occupations are women: Gender breakdown of the 10 largest low-wage occupations, 2013
| Occupation | Women | Men |
|---|---|---|
| Child care workers | 95% | 5% |
| Home health aides | 89% | 11% |
| Maids and housekeepers | 88% | 12% |
| Personal care aides | 84% | 16% |
| Cashiers | 72% | 28% |
| Waiters and waitresses | 70% | 30% |
| Food preparers and servers | 65% | 35% |
| Bartenders | 58% | 42% |
| Food preparers | 56% | 44% |
| Hand packers and packagers | 49% | 51% |
Source: Adapted from Entmacher et al. (2014)
The vast majority of low-wage workers don't have paid sick days: Share of private-sector workers who receive paid sick leave, by wage group, 2015
| Group | 2015 |
|---|---|
| Bottom 10% | 22% |
| Bottom 25% | 31% |
| Second 25% | 66% |
| Third 25% | 73% |
| Top 25% | 84% |
| Top 10% | 86% |
Source: EPI analysis of Bureau of Labor Statistics Employee Benefits Survey
88% of private-sector workers lack access to paid family leave: Share of private-sector workers without access to paid family leave, 2015
| Group | Share of private sector workers |
|---|---|
| Have access to paid family leave | 12% |
| Do not have paid family leave | 88% |
Source: EPI analysis of Bureau of Labor Statistics Employee Benefits Survey
The share of prime-age women with a job has fared worse in the U.S. than in peer countries: Employment-to-population ratio of women workers age 25–54, select countries, 1995–2014
| Canada | Germany | Japan | United States | |
|---|---|---|---|---|
| 1995 | 69.434551% | 66.360158% | 63.233624% | 72.189196% |
| 1996 | 69.577146% | 67.220440% | 63.701741% | 72.770073% |
| 1997 | 70.971110% | 67.399584% | 64.566038% | 73.541046% |
| 1998 | 72.183646% | 68.944387% | 64.036077% | 73.642970% |
| 1999 | 73.245982% | 70.253128% | 63.551051% | 74.147991% |
| 2000 | 73.944309% | 71.210539% | 63.582090% | 74.213847% |
| 2001 | 74.297867% | 71.607431% | 64.124398% | 73.421299% |
| 2002 | 75.348504% | 71.845950% | 63.863976% | 72.259684% |
| 2003 | 76.000458% | 71.981067% | 64.407421% | 72.006189% |
| 2004 | 76.720415% | 72.129055% | 65.028791% | 71.848458% |
| 2005 | 76.488663% | 70.969949% | 65.733178% | 71.963537% |
| 2006 | 76.984912% | 72.647765% | 66.614235% | 72.504467% |
| 2007 | 78.190906% | 74.045933% | 67.370518% | 72.501768% |
| 2008 | 78.008148% | 74.744854% | 67.495987% | 72.301570% |
| 2009 | 77.114622% | 75.420875% | 67.595960% | 70.208609% |
| 2010 | 77.075022% | 76.320711% | 68.157788% | 69.343654% |
| 2011 | 77.207691% | 77.892216% | 68.459240% | 68.967922% |
| 2012 | 77.710148% | 78.235789% | 69.161920% | 69.196894% |
| 2013 | 78.090883% | 78.625264% | 70.773639% | 69.253713% |
| 2014 | 77.444969% | 78.839200% | 71.835052% | 69.997790% |
Source: EPI analysis of OECD Labour Force Statistics
Capping child care costs at 10% of family income could boost GDP by $210 billion: Increase in size of state economy from capping out-of-pocket infant care expenditures at 10% of income
| State | Increase in state economy | Increase in state economy (in millions) | Increase in state economy | Increase in state economy (in millions) |
|---|---|---|---|---|
| Alaska | 1.0% | $562 | 1.9% | $1,099 |
| Alabama | 0.3% | $655 | 1.8% | $3,665 |
| Arkansas | 0.8% | $954 | 2.1% | $2,518 |
| Arizona | 1.3% | $3,853 | 2.1% | $6,083 |
| California | 1.5% | $33,498 | 2.1% | $49,529 |
| Colorado | 1.5% | $4,437 | 2.2% | $6,595 |
| Connecticut | 1.2% | $3,033 | 2.1% | $5,340 |
| Washington D.C. | 1.6% | $1,916 | 1.9% | $2,246 |
| Delaware | 1.2% | $774 | 2.1% | $1,356 |
| Florida | 1.2% | $10,404 | 2.1% | $17,781 |
| Georgia | 1.0% | $4,594 | 2.1% | $10,156 |
| Hawaii | 0.3% | $219 | 1.7% | $1,321 |
| Iowa | 1.1% | $1,793 | 2.1% | $3,645 |
| Idaho | 0.9% | $545 | 2.1% | $1,340 |
| Illinois | 1.6% | $11,490 | 2.3% | $16,821 |
| Indiana | 1.2% | $3,948 | 2.2% | $6,989 |
| Kansas | 1.5% | $2,177 | 2.3% | $3,329 |
| Kentucky | 0.5% | $939 | 1.8% | $3,330 |
| Louisiana | 0.2% | $625 | 1.7% | $4,356 |
| Massachusetts | 1.6% | $7,075 | 2.3% | $10,271 |
| Maryland | 1.3% | $4,378 | 2.1% | $7,240 |
| Maine | 1.1% | $623 | 1.9% | $1,009 |
| Michigan | 1.3% | $5,708 | 2.1% | $9,284 |
| Minnesota | 1.5% | $4,833 | 2.3% | $7,237 |
| Missouri | 1.1% | $3,180 | 2.3% | $6,557 |
| Mississippi | 0.3% | $290 | 1.9% | $1,971 |
| Montana | 1.1% | $472 | 2.0% | $872 |
| North Carolina | 1.5% | $7,135 | 2.4% | $11,550 |
| North Dakota | 0.4% | $232 | 1.7% | $941 |
| Nebraska | 0.7% | $771 | 2.0% | $2,170 |
| New Hampshire | 0.9% | $625 | 1.8% | $1,252 |
| New Jersey | 0.7% | $3,968 | 1.8% | $9,931 |
| New Mexico | 1.4% | $1,268 | 2.3% | $2,122 |
| Nevada | 1.4% | $1,925 | 2.2% | $2,975 |
| New York | 1.6% | $22,580 | 2.3% | $31,736 |
| Ohio | 1.1% | $6,583 | 2.2% | $12,401 |
| Oklahoma | 0.8% | $1,405 | 1.9% | $3,429 |
| Oregon | 1.6% | $3,333 | 2.3% | $4,792 |
| Pennsylvania | 1.1% | $7,560 | 2.0% | $13,172 |
| Rhode Island | 1.5% | $832 | 2.3% | $1,230 |
| South Carolina | 0.7% | $1,285 | 1.8% | $3,351 |
| South Dakota | ||||
| Tennessee | 0.4% | $1,087 | 1.6% | $4,897 |
| Texas | 1.2% | $20,139 | 2.2% | $35,942 |
| Utah | 0.8% | $1,128 | 1.9% | $2,692 |
| Virginia | 0.9% | $4,176 | 2.0% | $9,117 |
| Vermont | 1.3% | $375 | 2.1% | $623 |
| Washington | 1.4% | $5,966 | 2.1% | $8,978 |
| Wisconsin | 1.4% | $4,093 | 2.2% | $6,509 |
| West Virginia | 1.1% | $787 | 1.9% | $1,439 |
| Wyoming |
Women and workers of color are more likely to work part-time despite wanting full-time work: Share of all workers who are involuntary part-time workers, by gender, race, and ethnicity, 2014
| Race/ethnicity | Men | Women |
|---|---|---|
| All | 3.50% | 4.70% |
| White | 3.20% | 4.40% |
| Black | 5.70% | 6.00% |
| Hispanic | 5.30% | 7.50% |
Note: Involuntary part-time workers are workers who indicate that they would like to work full time but were working part time (1 to 34 hours) because of an economic reason, such as their hours being cut back or their inability to find full-time jobs.
Source: EPI analysis of Bureau of Labor Statistics Current Population Survey public data series
Elderly women are more likely than elderly men to be economically vulnerable: Share of the elderly at various income levels, expressed as multiples of the supplemental poverty measure (SPM) threshold, by gender
| Less than 1.0x SPM (economically vulnerable) | 1.0 to 1.99x SPM (economically vulnerable) | 2.0 to 3.99x SPM | At or above 4.0x SPM | |
|---|---|---|---|---|
| Women, age 65+ | 17.2% | 35.3% | 31.5% | 16.0% |
| Men, age 65+ | 12.7% | 29.2% | 35.1% | 23.0% |
Source: EPI analysis of pooled 2010–2012 Current Population Survey Annual Social and Economic Supplement microdata
Reducing unemployment would disproportionately boost low- and moderate-wage workers' wages: Effect on hourly wages of a one-point decline in unemployment rate, by decile and gender
| Men | Women | |
|---|---|---|
| 10th | 2.0% | 1.4% |
| 20th | 1.6% | 1.0% |
| 30th | 1.5% | 1.0% |
| 40th | 1.0% | 0.9% |
| 50th | 0.9% | 0.9% |
| 60th | 0.8% | 0.7% |
| 70th | 0.9% | 0.5% |
| 80th | 0.8% | 0.6% |
| 90th | 0.5% | 0.8% |
Note: Figure is based on data from 1979 to 2007.
Source: EPI analysis of Current Population Survey Outgoing Rotation Group microdata
Women earn more when they collectively bargain, regardless of race or ethnicity: Median weekly earnings for full-time women workers, by union status and race/ethnicity, 2014
| Union | Nonunion | |
|---|---|---|
| All women | $899 | $687 |
| White | $923 | $704 |
| Black | $788 | $590 |
| Hispanic | $739 | $520 |
| Asian | $950 | $823 |
Note: Data are for full-time wage and salary workers.
Source: Adapted from Anderson, Hegewisch, and Hayes (2015)
Women generally experience a smaller pay gap when their workplace is unionized: Women's median weekly earnings for full-time wage and salary employees as a percent of men's, by race and ethnicity, 2014
| Race | Union | Non-union |
|---|---|---|
| All | 88.7% | 81.8% |
| White | 88.7% | 81.2% |
| Black | 94.6% | 91.0% |
| Hispanic | 88.2% | 87.2% |
| Asian | 91.3% | 75.7% |
Notes: The values represent the difference between the median weekly earnings of full-time wage and salary workers who are union members or are covered by a union contract and those who are not.
Source: EPI analysis of Anderson, Hegewisch, and Hayes, 2015.
Median hourly compensation growth is lower in states where collective bargaining coverage declined the most, 1979–2012
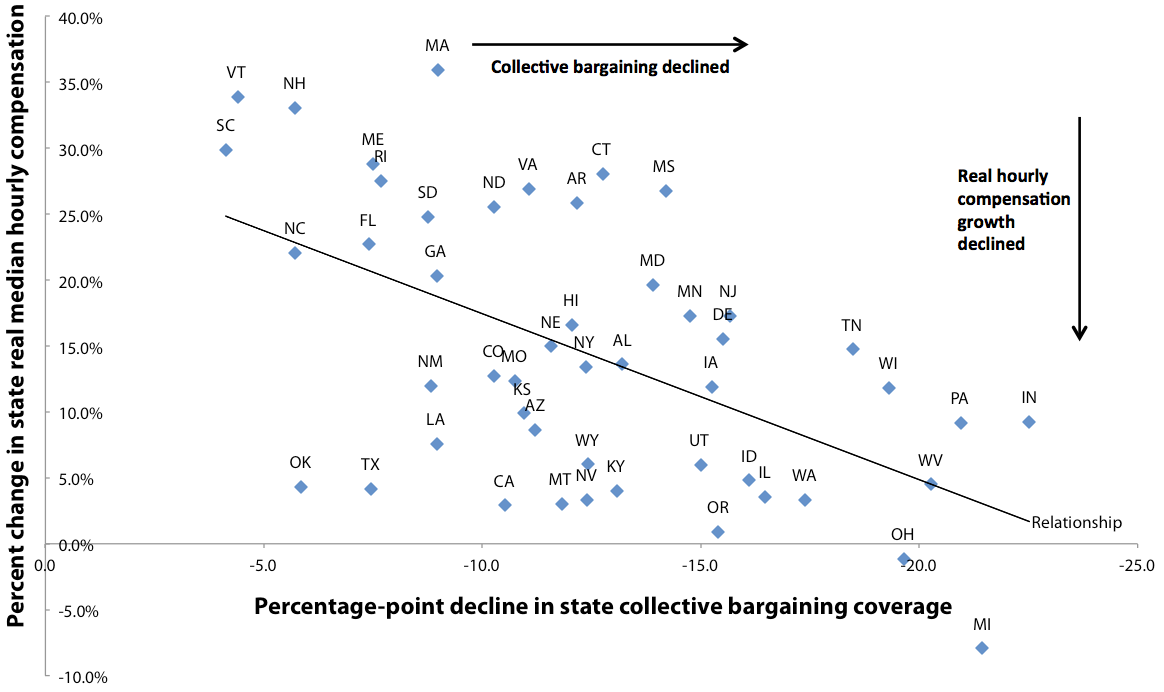
Note: Excludes Alaska and the District of Columbia.
Source: EPI analysis of wage data from the Current Population Survey; compensation data from the Bureau of Economic Analysis, State/National Income and Product Accounts public data series; and collective bargaining data from the Current Population Survey
As union membership has fallen, the top 10 percent have been getting a larger share of income: Union membership and share of income going to the top 10%, 1917–2014
| Year | Union membership | Share of income going to the top 10 percent |
|---|---|---|
| 1917 | 11.0% | 40.3% |
| 1918 | 12.1% | 39.9% |
| 1919 | 14.3% | 39.5% |
| 1920 | 17.5% | 38.1% |
| 1921 | 17.6% | 42.9% |
| 1922 | 14.0% | 42.9% |
| 1923 | 11.7% | 40.6% |
| 1924 | 11.3% | 43.3% |
| 1925 | 11.0% | 44.2% |
| 1926 | 10.7% | 44.1% |
| 1927 | 10.6% | 44.7% |
| 1928 | 10.4% | 46.1% |
| 1929 | 10.1% | 43.8% |
| 1930 | 10.7% | 43.1% |
| 1931 | 11.2% | 44.4% |
| 1932 | 11.3% | 46.3% |
| 1933 | 9.5% | 45.0% |
| 1934 | 9.8% | 45.2% |
| 1935 | 10.8% | 43.4% |
| 1936 | 11.1% | 44.8% |
| 1937 | 18.6% | 43.3% |
| 1938 | 23.9% | 43.0% |
| 1939 | 24.8% | 44.6% |
| 1940 | 23.5% | 44.4% |
| 1941 | 25.4% | 41.0% |
| 1942 | 24.2% | 35.5% |
| 1943 | 30.1% | 32.7% |
| 1944 | 32.5% | 31.5% |
| 1945 | 33.4% | 32.6% |
| 1946 | 31.9% | 34.6% |
| 1947 | 31.1% | 33.0% |
| 1948 | 30.5% | 33.7% |
| 1949 | 29.6% | 33.8% |
| 1950 | 30.0% | 33.9% |
| 1951 | 32.4% | 32.8% |
| 1952 | 31.5% | 32.1% |
| 1953 | 33.2% | 31.4% |
| 1954 | 32.7% | 32.1% |
| 1955 | 32.9% | 31.8% |
| 1956 | 33.2% | 31.8% |
| 1957 | 32.0% | 31.7% |
| 1958 | 31.1% | 32.1% |
| 1959 | 31.6% | 32.0% |
| 1960 | 30.7% | 31.7% |
| 1961 | 28.7% | 31.9% |
| 1962 | 29.1% | 32.0% |
| 1963 | 28.5% | 32.0% |
| 1964 | 28.5% | 31.6% |
| 1965 | 28.6% | 31.5% |
| 1966 | 28.7% | 32.0% |
| 1967 | 28.6% | 32.0% |
| 1968 | 28.7% | 32.0% |
| 1969 | 28.3% | 31.8% |
| 1970 | 27.9% | 31.5% |
| 1971 | 27.4% | 31.8% |
| 1972 | 27.5% | 31.6% |
| 1973 | 27.1% | 31.9% |
| 1974 | 26.5% | 32.4% |
| 1975 | 25.7% | 32.6% |
| 1976 | 25.7% | 32.4% |
| 1977 | 25.2% | 32.4% |
| 1978 | 24.7% | 32.4% |
| 1979 | 25.4% | 32.3% |
| 1980 | 23.6% | 32.9% |
| 1981 | 22.3% | 32.7% |
| 1982 | 21.6% | 33.2% |
| 1983 | 21.4% | 33.7% |
| 1984 | 20.5% | 33.9% |
| 1985 | 19.0% | 34.3% |
| 1986 | 18.5% | 34.6% |
| 1987 | 17.9% | 36.5% |
| 1988 | 17.6% | 38.6% |
| 1989 | 17.2% | 38.5% |
| 1990 | 16.7% | 38.8% |
| 1991 | 16.2% | 38.4% |
| 1992 | 16.2% | 39.8% |
| 1993 | 16.2% | 39.5% |
| 1994 | 16.1% | 39.6% |
| 1995 | 15.3% | 40.5% |
| 1996 | 14.9% | 41.2% |
| 1997 | 14.7% | 41.7% |
| 1998 | 14.2% | 42.1% |
| 1999 | 13.9% | 42.7% |
| 2000 | 13.5% | 43.1% |
| 2001 | 13.5% | 42.2% |
| 2002 | 13.3% | 42.4% |
| 2003 | 12.9% | 42.8% |
| 2004 | 12.5% | 43.6% |
| 2005 | 12.5% | 44.9% |
| 2006 | 12.0% | 45.5% |
| 2007 | 12.1% | 45.7% |
| 2008 | 12.4% | 46.0% |
| 2009 | 12.3% | 45.5% |
| 2010 | 11.9% | 46.4% |
| 2011 | 11.8% | 46.6% |
| 2012 | 11.2% | 47.8% |
| 2013 | 11.2% | 47.0% |
| 2014 | 11.1% | 47.2% |
Source: Piketty and Saez (2014), Gordon (2013), and Bureau of Labor Statistics Current Population Survey public data series
Data on union density follows the composite series found in Historical Statistics of the United States; updated to 2014 from unionstats.com. Income inequality (share of income to top 10%) from Piketty and Saez, “Income Inequality in the United States, 1913-1998, Quarterly Journal of Economics, 118(1), 2003, 1-39. Updated data for this series and other countries, is available at the Top Income Database. Updated 2016.
Women are more likely to have health insurance and retirement benefits when they’re covered by a union: Share of women with employer-sponsored health insurance and retirement benefits, by union status, 2008–2012
| Union | Nonunion | |
|---|---|---|
| Health insurance coverage | 73.1% | 49.1% |
| Retirement plan | 74.4% | 41.8% |
Source: Adapted from Jones, Schmitt, and Woo (2014)
Thank you!
Women’s Economic Agenda: epi.org/womens-agenda
Economic Policy Institute: epi.org