Figure B
Median hourly compensation growth is lower in states where collective bargaining coverage declined the most, 1979–2012
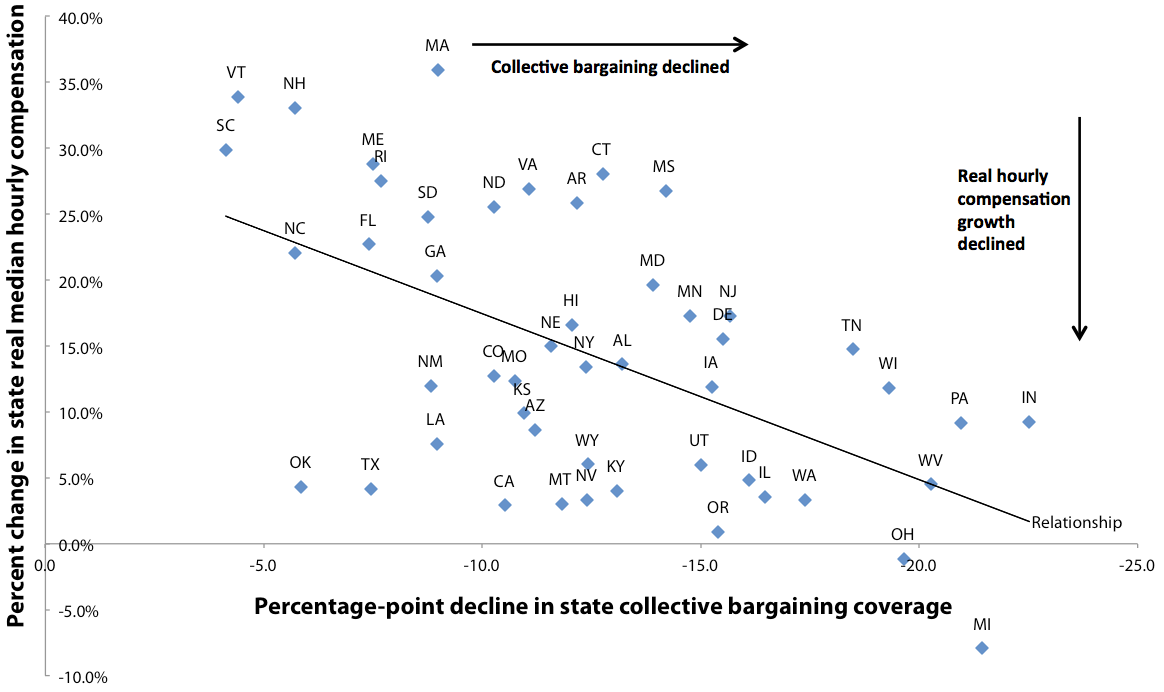

Note: Excludes Alaska and the District of Columbia.
Source: EPI analysis of wage data from the Current Population Survey; compensation data from the Bureau of Economic Analysis, State/National Income and Product Accounts public data series; and collective bargaining data from the Current Population Survey
This chart appears in:
Previous chart: « Median hourly compensation growth lower in states where collective bargaining declined most, 1979–2012