By Andrea Orr
The 400 American families with the highest incomes have seen a dramatic decline in their effective tax rate since 1992. The decline has been especially steep since 2002. The Figure compares the effective tax rate – the portion of income paid in taxes – of the country’s highest income households to that of all households between 1992 and 2007, the last year for which data are available.
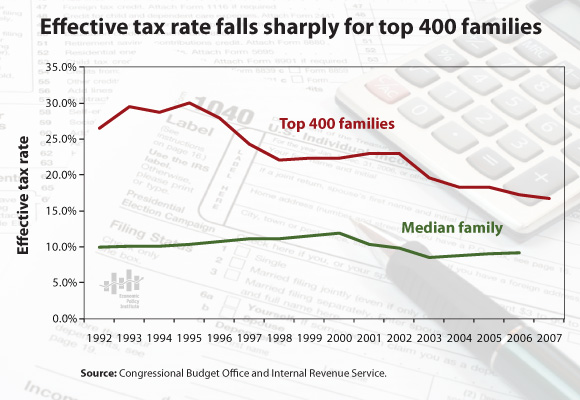
The top households saw their effective tax rate decline almost 10 percentage points, from 26.4% in 1992 to 16.6% in 2007. By comparison, the average household saw effective tax rates decline less than one percentage point, from 9.9% in 1992 to 9.1% in 2006, also the last year for which data are available. The change in tax rates over time shows that while the United States still has a progressive tax system in which those with higher incomes pay higher tax rates, it is a lot less progressive than it used to be.
As the top 400 households saw tax rates fall sharply, they also enjoyed a level of pre-tax income growth that far outpaced the median household. EPI President Lawrence Mishel addressed this disparity in the recent economic snapshot, Where has all the income gone? Look up. Adjusted pre-tax household income grew just 13.2% between 1992 and 2007 for the median family of four, but surged 409% for the top 400 households. In 2007 the median household income for a family of four was $50,233, while the 400 households at the top of the income range had an average annual income of $345 million.