March 9, 2007
Solid jobs report, but lots of reasons to stay nervous
By Jared Bernstein with research assistance from James Lin
The nation’s payrolls grew by 97,000 in February, and unemployment was essentially unchanged, according to today’s report by the Bureau of Labor Statistics (BLS). Though the rate of growth was below the pace of recent months, given mitigating factors, the report suggests the job market remains relatively solid. There are, however, some early indicators that the slowing economy may be showing up in slower job and hours growth.
One important factor leading to lower job growth in February was the shift from warmer than usual to colder weather during the month, most visible in the loss of 62,000 construction jobs. Residential construction has been slipping lately due to the ongoing housing slump, but large job losses in nonresidential construction were probably weather related.
Due to construction losses, along with continued declines in manufacturing, private sector employment was up only 58,000 last month, its lowest monthly gain since November 2004. However, government at all levels added 39,000 jobs, with most of the gains coming from state (18,000) and local (17,000) sectors.
Excluding government, construction, and manufacturing, the private service sector, which represents 67.5% of total employment, added 129,000 jobs in February, driven by the usual suspects: health care (33,000), restaurants (21,000), and professional services (29,000).
Manufacturing continues to shed jobs, down 14,000 in February. Though many commentators focus on the declining auto sector, the fact is that most sub-industries under manufacturing have been cutting their payrolls. Since last August, on a monthly basis, fewer than half of 84 manufacturing sub-industries have been expanding. Hourly earnings of blue-collar workers in manufacturing earnings have also been growing much more slowly than average earnings. They were unchanged last month, and have been growing at a yearly rate of less than 2%, before inflation, since February 2006.
The slight down tick in the unemployment rate, from 4.6% to 4.5%, is not indicative of a tightening job market. For reasons that are likely anomalous, the labor force, as measured by the BLS Household Survey, contracted by 190,000 last month, and employment fell 38,000 in this survey. This looks more like monthly data volatility (did Greenspan say something!?) than actual labor market changes.
Wages rose a greater than expected 0.4% last month, up 4.1% on a yearly basis, well ahead of inflation, which has been running at around 2-2.5%. Though inflation hawks may be spooked by a rise in hourly earnings, note that:
- average weekly hours contracted by six minutes (for the second month in a row), so weekly earnings rose only 0.1%;
- yearly hourly wage growth has been firmly within a “high 3’s/low 4’s” percent range since last spring;
- accelerating unit labor costs (compensation relative to productivity growth) has not fed into core inflation in recent years.
An interesting thematic question from today’s report is whether it provides any evidence that the slowing aspects of the current economy are feeding into the job market. The impact of unusual weather makes it tougher to pull out this signal, and, as noted, private services continue to generate decent growth numbers. Also, continued real wage growth, considerably more broad-based than was the case earlier in the recovery, is helping to boost consumption, up 4.2% at the end of last year. This spending continues to boost job growth in services, such as health care, restaurants, and businesses.
On the negative side of the economy’s ledger, real GDP growth, up 2.2%, was well off trend in the fourth quarter, claims for unemployment insurance by job losers have been gradually rising (long-term unemployment spiked up by 1.7 points in today’s report), and the housing slump continues to deepen.
These negatives show up in factory employment and housing related sectors, and are contributing to the slide in total hours worked in the economy, an important forward-looking indicator of earnings and income growth. Though here too, weather played a role: the aggregate hours measure (which excludes government) fell 0.3% last month, the largest monthly drop since June 2004, and is up only 1.5% over the past year. Moreover, as shown in the chart below, this indicator has been trending down lately.
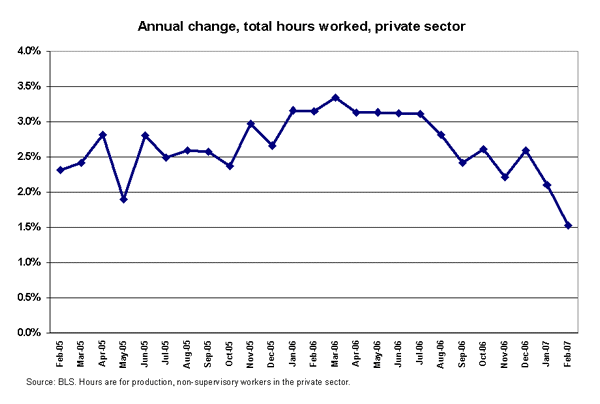
If this negative trend in aggregate hours deepens, it will surely begin to constrain the earnings and incomes of working families, which in turn will result in less consumption and diminished hiring. For now, though, the labor market remains relatively tight.
To view archived editions of JOBS PICTURE, click here.
The Economic Policy Institute JOBS PICTURE is published each month upon release of the Bureau of Labor Statistics’ employment report.
EPI offers same-day analysis of income, price, employment, and other economic data released by U.S. government agencies. For more information, contact EPI at 202-775-8810.