Figure N1
Percent of total federal employment law violations detected by the Wage and Hour Division among farm labor contractors in California, by county, fiscal years 2005–2019
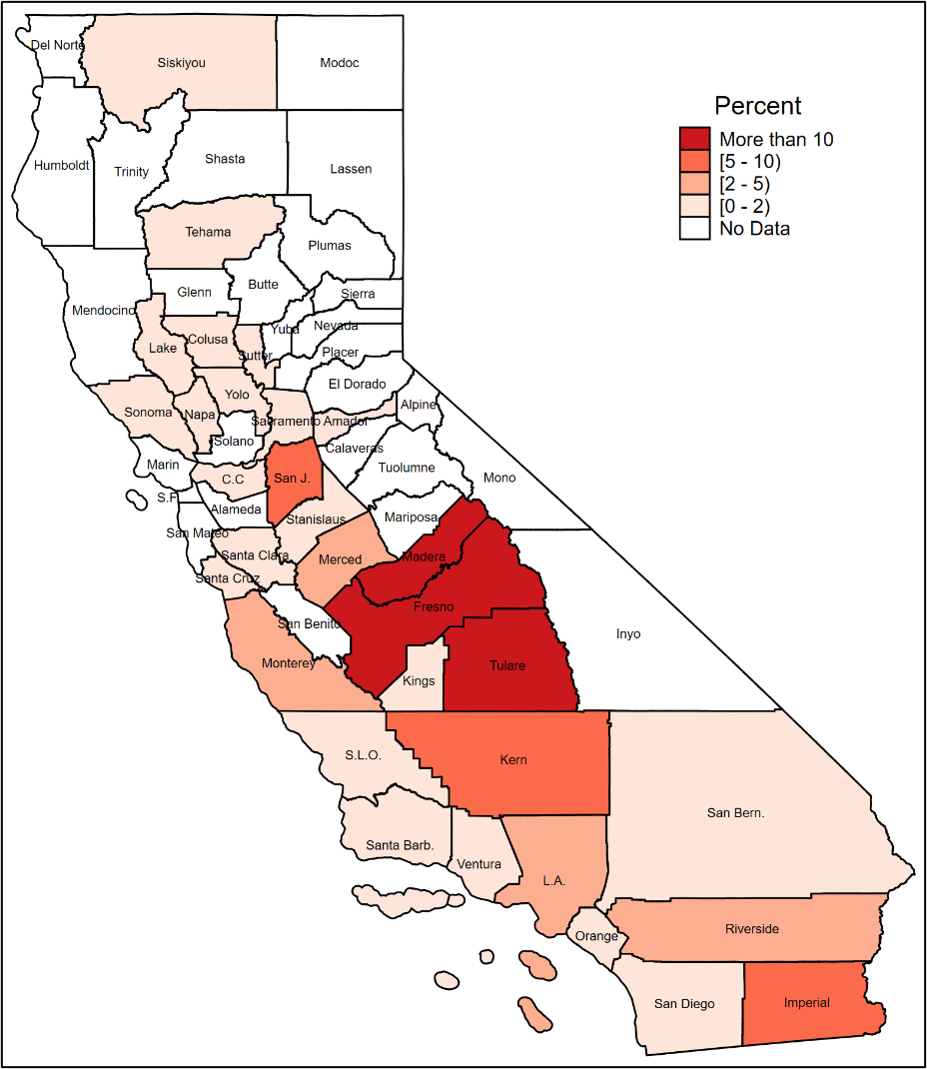

Note: The county-level data in this figure were constructed from data that identifies the Zip code where the employer was located. Some California Zip codes cross county boundaries and, as a result, some investigations could not be assigned to a county.
Source: Authors' analysis of U.S. Department of Labor, Wage and Hour Compliance Action Data (U.S. DOL-WHD 2020f).
This chart appears in:
Next chart: Percent of total California farm labor contractor employment by county, 2018 »