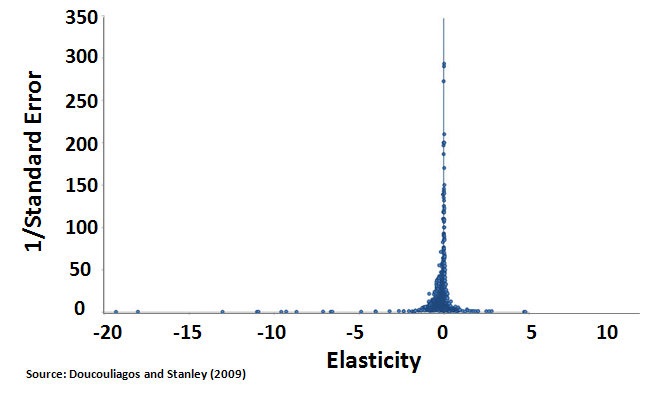
Figure AFunnel Graph of Estimated Minimum Wage Effects (n=1,492) Share on Facebook Tweet this chart EmbedCopy the code below to embed this chart on your website.<iframe width="100%" height="460" src="https://www.epi.org?p=107890&view=embed&embed_template=charts_v2013_08_21&embed_date=20240427&onp=107890&utm_source=epi_press&utm_medium=chart_embed&utm_campaign=charts_v2" frameborder="0"></iframe> Download image Previous chart: « Growth in the number of full-service restaurant establishments and employment by type of tipped wage, 2011–2014 Next chart: On-demand work is mostly part-time and one of multiple income streams: Proportion of total work hours spent at each activity »